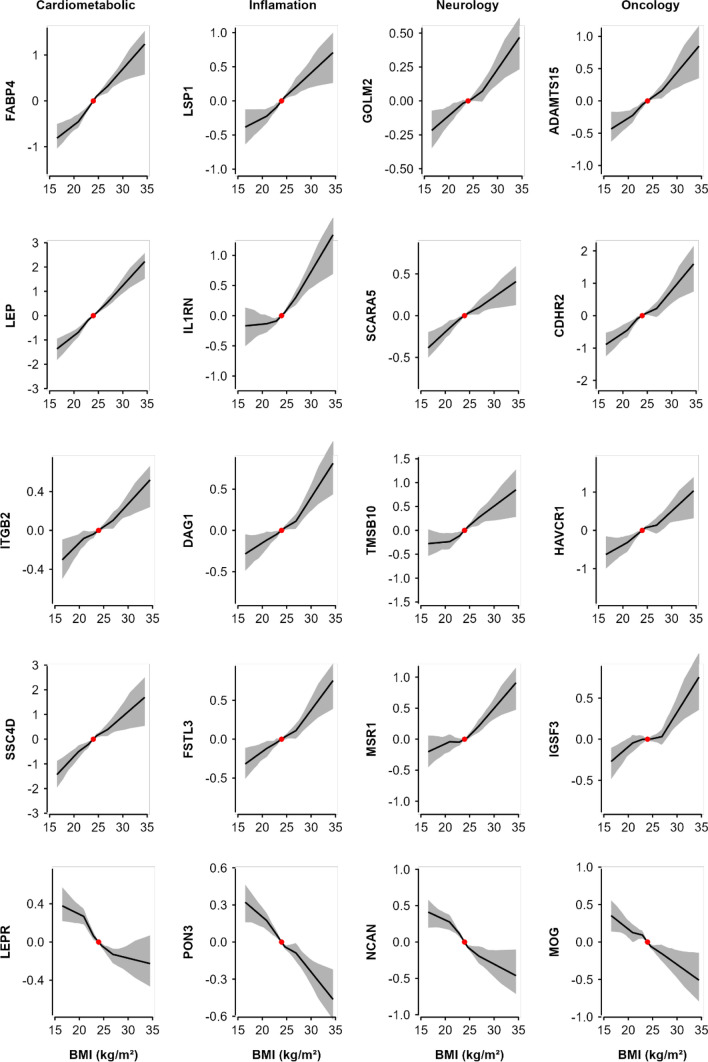
Fig. 3.
Genetic associations of BMI with 20 selected proteins, by OLINK panel. Non-linear MR analyses was used to investigate the shape of the genetic associations. Within each panel, top 5 (4 positive and 1 inverse) BMI-associated proteins were included. Piecewise linear method was used to calculate the estimates (adjusted for age, age squared, sex, and study area [ten groups], ascertainment, plate ID, and 12 national PCs). Each line segment begins where the previous segment finished (black lines) and the intercept was set to the population mean BMI (red dot). The 95% CI are represented by the shaded patterns. The length of y-axis represents approximately ± 2 SD from the mean of the corresponding protein

