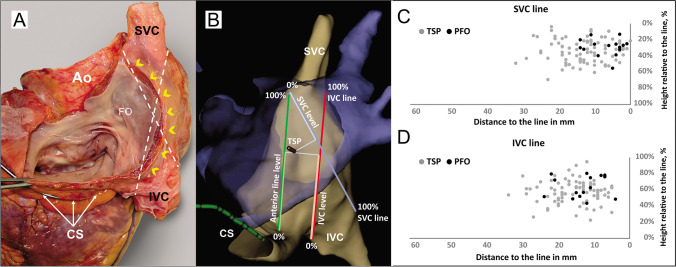
Fig. 1.
A Anatomical specimen showing the structures of interatrial septum from the left atrial side. Dotted lines describes the SVC and IVC lines; the yellow arrowheads along the Waterstones groove. B 3D-electroanatomical map of the right atrium (gray) and the integrated CT scan of the left atrium in blue. Schematical illustration of additional anatomical measurements: Anterior; SVC and IVC lines; distances from the TSP to the lines as well as level of the TSP according to the line (measured in percentage): anterior line level; SVC level and IVC level. C and D Scatter plots demonstrating TSP sites in relation to the lines. SVC, superior vena cava; IVC, inferior vena cava; TSP, transseptal puncture (gray dots); PFO, persistent foramen ovale (black dots). FO, fossa ovalis; Ao, ascending aorta; IVC, inferior vena cava; SVC, superior vena cava; CS, coronary sinus; TSP, transseptal puncture

