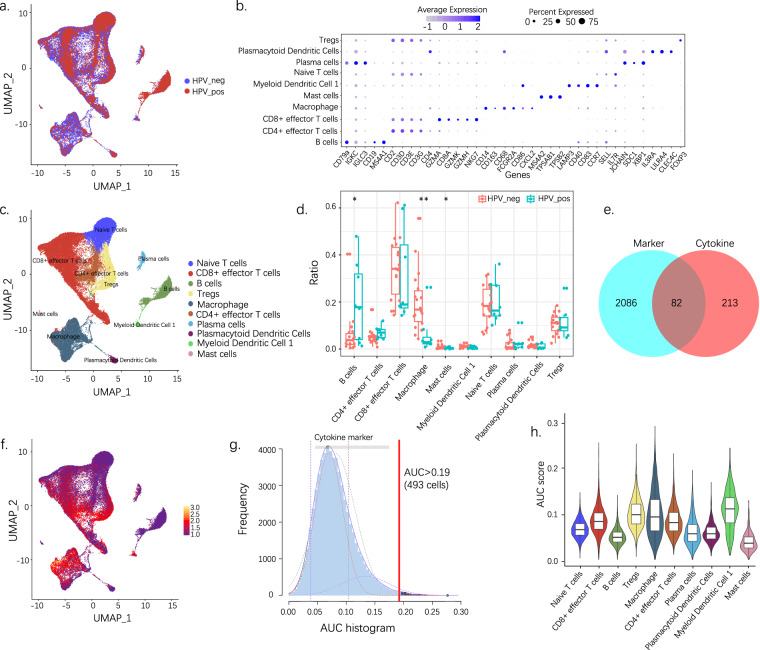
Fig. 1.
Single-cell analysis reveals the immune cell heterogeneity and cytokine activity between HPV+ and HPV− HNSCC. (a) UMAP visualization of different HPV statuses. (b) Expression of marker genes for 10 distinct cell types. (c) UMAP visualization of predicted cell types. (d) Ration comparison of each cell type in HPV+ and HPV− samples. (e) Eighty-two differentially expressed cytokines are selected for further analysis. (f) The scores of the 82 DEGs. The threshold was chosen as 0.19, and the DEG score of 493 cells exceeded the value. (g) UMAP plots based on the DEG score for each cell. Cell clusters with a high score are highlighted. (h) Violin plot showing the cytokine activity of each cell type. UMAP, Uniform manifold approximation and projection; DEG, differentially expressed gene. *p < 0.05; **p < 0.01.

