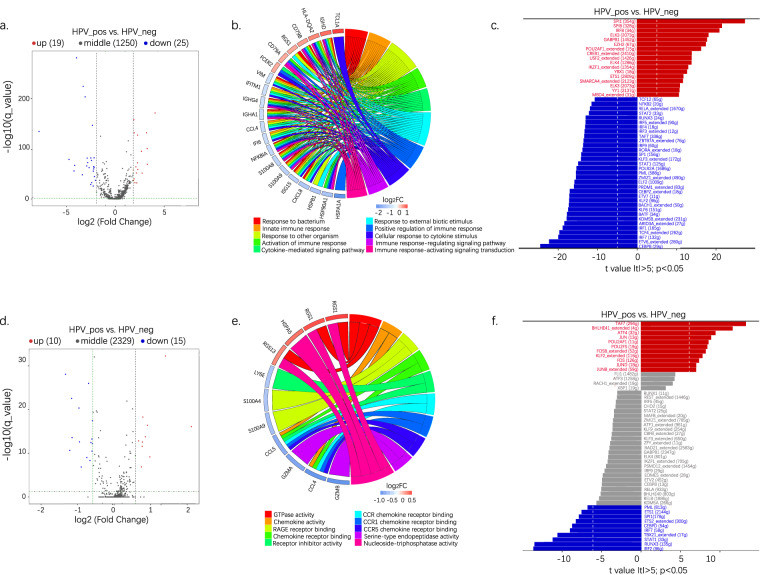
Fig. 4.
Bulk-cell analysis reveals differentially expressed genes and a functional B and plasma cells analysis. (a) Volcano plots show the DEGs of B cells. (b) GO enrichment analysis of DEGs of B cells. (c) Expression of cytokine-related TFs in B cells. (d) Volcano plots showing DEGs of plasma cells. (e) GO enrichment analysis of DEGs of plasma cells. (f) Expression of cytokine-related TFs in plasma cells. DEG, differentially expressed gene; TF, transcription factor.

