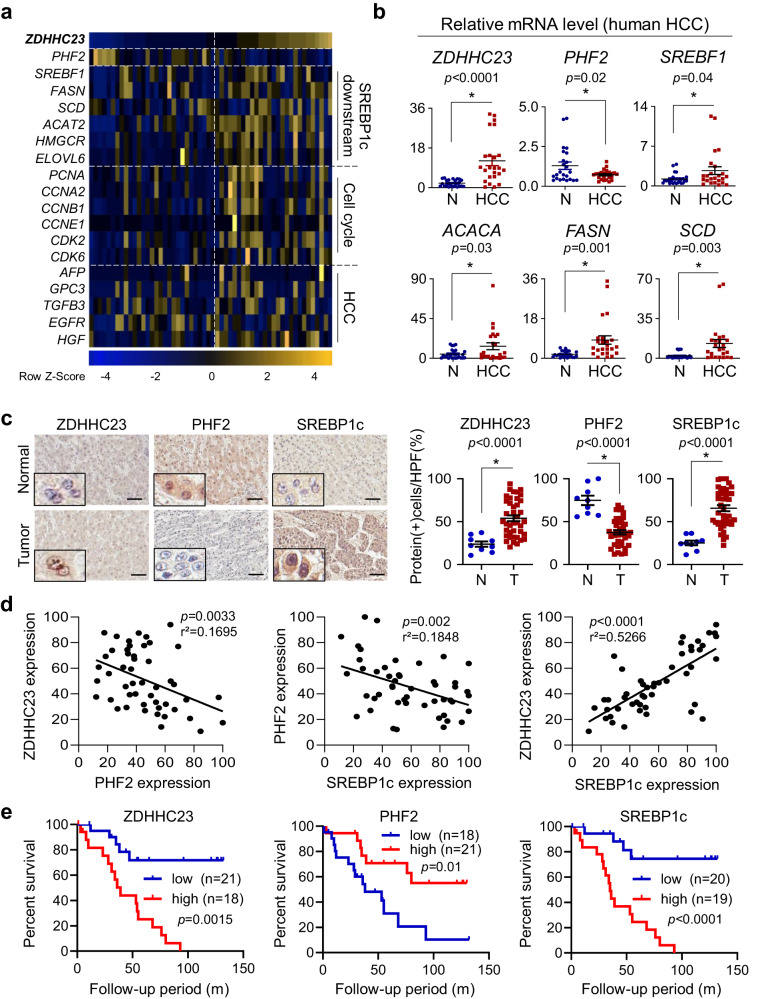
Fig. 8. PHF2, ZDHHC23, and SREBP1c expression are reciprocally associated with clinical outcomes in HCC.
a The profile of gene expressions of liver tissues obtained from the NCBI GEO dataset (GSE54238). A heatmap of gene expressions was displayed based on ZDHHC23 expression values. The color scale bar represents relative expression values ranging from low (blue) to high (yellow). b The mRNA levels were measured in HCC tissues and adjacent normal liver tissues from 30 HCC patients. Comparisons were performed by the unpaired t-test; mean ± SD (n = 30 independent liver tissues). Statistical analyses were based on a two-tailed unpaired t-test. c–e Analysis of a human HCC tissue array containing 38 pairs of clinical HCC with corresponding nine normal tissues (SuperBioChips Lab, Seoul, South Korea). c (Left) Representative images of HCC tissues immunostained with the indicated antibodies. Scale bar = 60 µm. (Right) The staining scores were calculated based on immune-positive cell numbers; mean ± SD; P values were calculated by a two-tailed unpaired t-test. HPF a high-power field; N adjacent normal tissues; T HCC tissues. d A simple linear regression analysis examined correlations between proteins in HCC tissues. r2, a measure of goodness-of-fit, is calculated by comparing the sum-of-squares from the regression line with the sum-of-squares. e Kaplan–Meier analysis of the survival of HCC patients. Blue and red lines represent the indicated proteins’ low- and high-expression groups, respectively. P values were calculated using the log-rank test.

