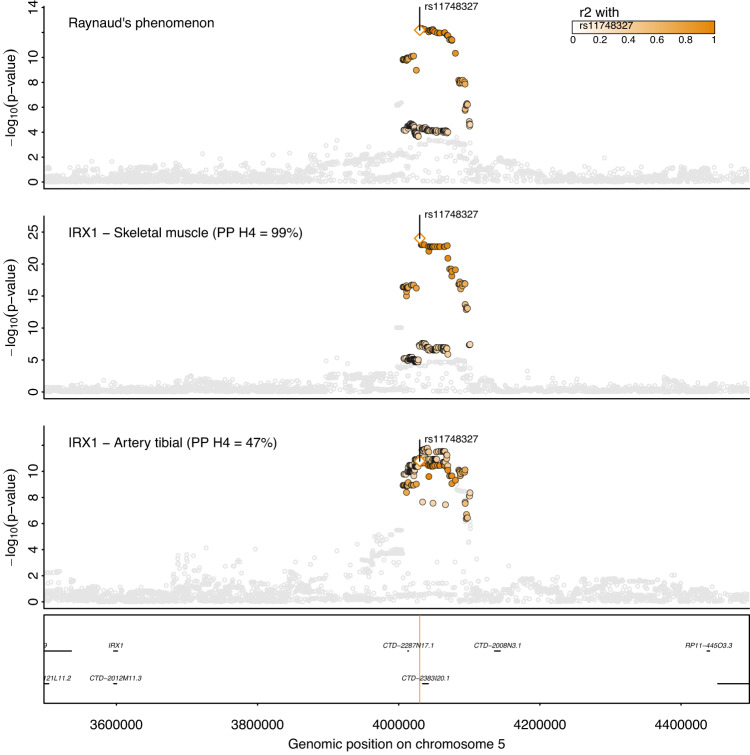
Fig. 3. Regional association plot at IRX1.
Regional association plot for Raynaud’s phenomenon (top), gene expression of IRX1 in skeletal muscle (middle), and gene expression of IRX1 in tibial artery (bottom). Summary statistics from logistic regression models for RP are from the present study whereas summary statistics from linear regression models were obtained from GTEx v822. Colouring of SNPs is based on linkage disequilibrium with the lead RP variant (rs12653958) at this locus. Numbers in brackets indicate posterior probabilities (PP) for a shared genetic signal with RP based on statistical colocalization.

