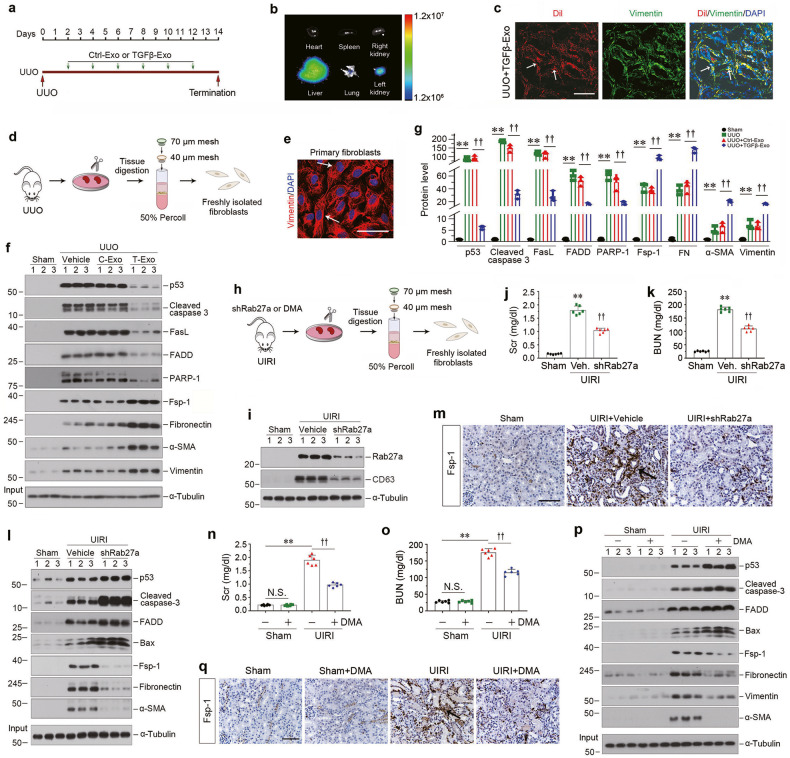
Fig. 3. Tubular cells-derived exosomes attenuate renal fibroblast apoptosis in vivo.
a Experimental design. Green arrows indicate the time points when HK-2 cells-derived exosomes (CTL-Exo or TGFβ-Exo, 200 μg) were injected intravenously. b Imaging of fluorescence intensity show Dil-C18-labeled exosomes in indicated organs at 1 day after the last intravenous injection. Dil-C18-labeled exosomes (red) isolated from TGF-β1-treated HK-2 cells were injected through the tail vein into UUO mice. c Representative images show Dil-C18-labeled exosomes in mouse kidney at 1 day after the last intravenous injection. Kidney cryosections were visualized for tracking Dil-C18-labeled exosomes (red) and activated fibroblasts (green) by immunofluorescence staining of vimentin. Arrows indicate positive labeling and staining. Scale bar, 50 µm. d Diagram shows the procedure of renal primary fibroblasts isolation. e Representative micrograph shows the vimentin expression of primary fibroblasts isolated from kidney after UUO. Arrows indicate positive staining. Scale bar, 50 µm. f, g Western blot analyses show the protein level changes of p53, cleaved caspase-3, FasL, FADD, PARP-1, Fsp-1, fibronectin, α-SMA and vimentin in different groups of primary fibroblasts isolated from kidney at 14 days after UUO. Representative Western blot (f) and quantitative data (g) are presented. Numbers (1–3) indicate a pool of primary fibroblasts isolated from two animals. **P < 0.01, ††P < 0.01 (n = 3). h Diagram shows the experimental design in UIRI model. i Western blot analyses show renal expression of Rab27a and CD63 in different groups as indicated. Numbers (1–3) indicate each individual animal in a given group. j Graphic presentation shows the serum creatinine levels in different groups at 11 days after IRI. **P < 0.01, ††P < 0.01 (n = 6). k Graphic presentation shows the blood urea nitrogen levels in different groups at 11 days after IRI. **P < 0.01, ††P < 0.01 (n = 6). l Western blot analyses show the protein levels of p53, cleaved caspase-3, FADD, Bax, Fsp-1, fibronectin and α-SMA in different groups of primary fibroblasts isolated from kidney at 11 days after UIRI. Numbers (1–3) indicate a pool of primary fibroblasts isolated from two animals. m Representative micrographs show Fsp-1-positive cells in different groups as indicated. Scale bar, 50 µm. n Serum creatinine levels in different groups of mice as indicated. **P < 0.01, ††P < 0.01, N.S. not significant (n = 6). o Blood urea nitrogen levels in different groups of mice as indicated. **P < 0.01, ††P < 0.01, N.S. not significant (n = 6). p Western blot analyses show the protein levels of p53, cleaved caspase-3, FADD, Bax, Fsp-1, fibronectin, vimentin and α-SMA in primary fibroblasts isolated from UIRI after DMA treatment. Numbers (1–3) indicate a pool of primary fibroblasts isolated from two animals. q Representative micrographs show Fsp-1-positive cells in different groups as indicated. Scale bar, 50 µm. Data presented as mean ± S.E.M. of three independent experiments. p values were calculated using Student-Newman-Kuels test for multiple groups comparison.

