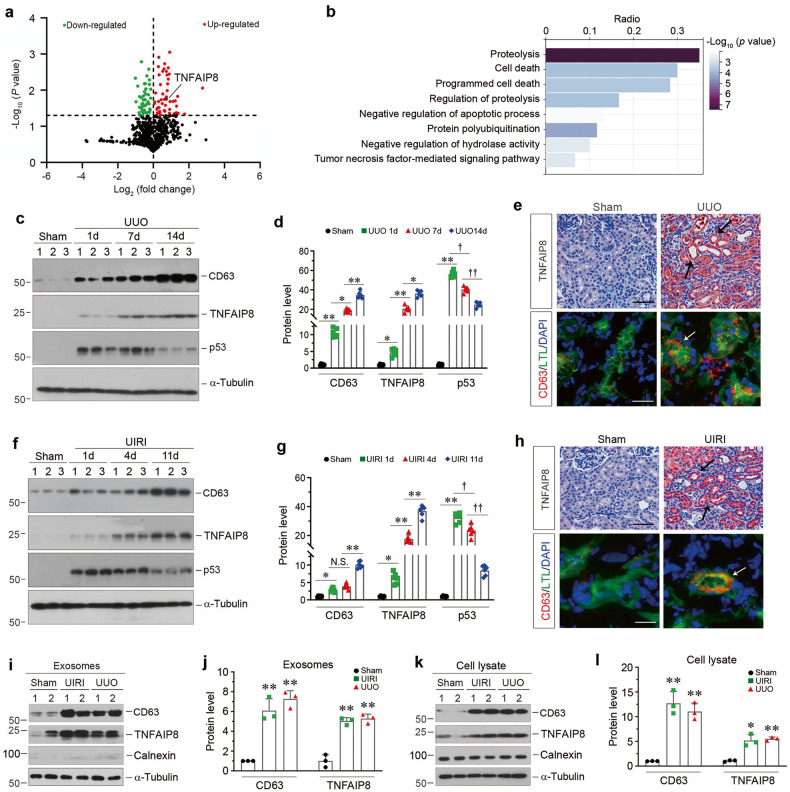
Fig. 4. TNFAIP8 is enriched in tubular cells-derived exosomes and upregulated in various models of CKD.
a Volcano plot shows the differentially expressed proteins of exosomes released from HK-2 cells without or with TGF-β1 treatment. b Gene ontology (GO) enrichment analysis reveals that several biological processes were enriched as indicated. c, d Western blot analyses show the renal expression of CD63, TNFAIP8 and p53 at different time points after UUO. Representative Western blot (c) and quantitative data (d) are presented. Numbers (1–3) indicate each individual animal in a given group. *P < 0.05, **P < 0.01, †P < 0.05, ††P < 0.01 (n = 6). e Representative micrographs of immunohistochemical and immunofluorescence staining show tubular TNFAIP8 and CD63 expression in the kidney after UUO. Double immunofluorescence staining demonstrates the generation of exosomes predominantly in the proximal tubular epithelium. Kidney sections were co-stained for CD63 (Red) and lotus tetragonolobus lectin (LTL) (Green). Arrow indicates positive staining. Scale bar, 50 µm. f, g Western blot analyses show the renal expression of CD63, TNFAIP8 and p53 at different time points after UIRI. Representative Western blot (f) and quantitative data (g) are presented. Numbers (1–3) indicate each individual animal in a given group. *P < 0.05, **P < 0.01, †P < 0.05, ††P < 0.01, N.S. not significant (n = 6). h Representative micrographs of immunohistochemical and immunofluorescence staining show tubular TNFAIP8 and CD63 expression in the kidney after UIRI. Kidney sections were co-stained for CD63 (Red) and lotus tetragonolobus lectin (LTL) (Green). Arrow indicates positive staining. Scale bar, 50 µm. i, j Western blot analyses show the presence of CD63 and TNFAIP8 proteins in the exosomes isolated from kidneys after UIRI or UUO. Representative Western blot (i) and quantitative data (j) are presented. Numbers (1 and 2) indicate a pool of exosomes isolated from two animals. **P < 0.01 versus sham controls (n = 3). k, l Western blot analyses show the presence of CD63, TNFAIP8, Calnexin proteins in the primary cells isolated from kidneys after UIRI or UUO. Representative Western blot (k) and quantitative data (l) are presented. Numbers (1 and 2) indicate a pool of primary cells isolated from two animals. *P < 0.05, **P < 0.01 versus sham controls (n = 3). Data presented as mean ± S.E.M. of three or six independent experiments. p values were calculated using Student-Newman-Kuels test for multiple groups comparison.

