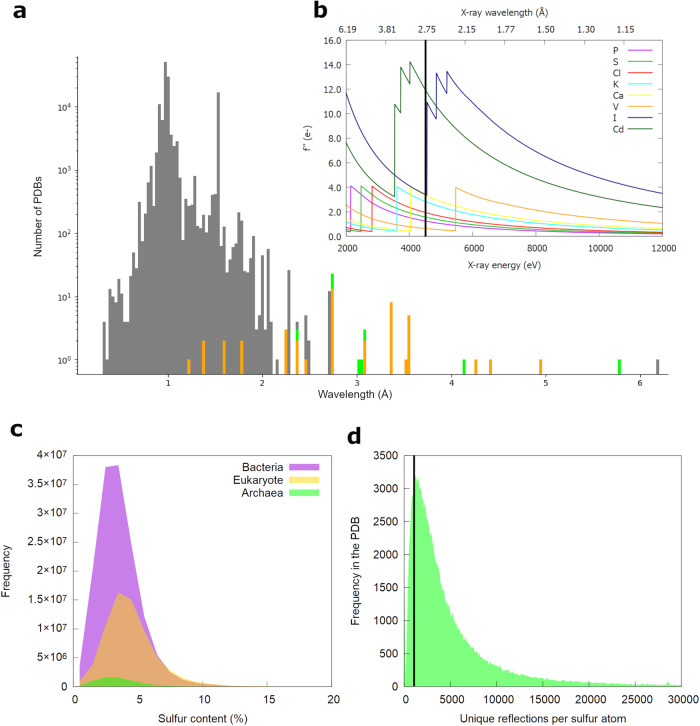
Fig. 1. Distribution of wavelengths and sulfur content for native phasing.
a Distribution of X-ray wavelengths used for crystallographic data collections from the PDB (gray: 132921 PDBs). Datasets from beamline I23 are indicated in orange (45 PDBs), and the ones presented in this paper are colored in green. b Variation of coefficient f” with X-ray wavelength (or energy) showing typical absorption K-edges (P, S, Cl, Ca, V) and L-edges (I and Cd) accessible at the I23 beamline. The vertical bar indicates the wavelength of λ = 2.75 Å (E = 4.5 keV). c Distribution of sulfur content (%) in the three kingdoms of life, Bacteria (147178681 sequences), Eukaryote (68547281 sequences), and Archaea (6753728 sequences). d Distribution of the ratio of unique reflections per sulfur atom in structures deposited in the PDB, the vertical bar indicates a ratio of 1000.

