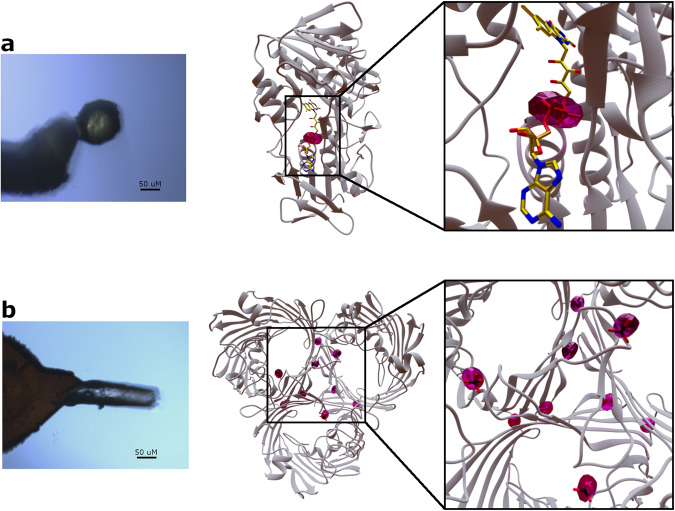
Fig. 4. Native SAD with laser-shaped crystals.
a On the left, spherically shaped crystal of BphA4. On the right, the crystal structure of BphA4 is shown as a cartoon representation and colored in gray while the FAD molecule is depicted as sticks. b On the left, a cylindrically shaped crystal of OmpK36. On the right, the crystal structure of the trimeric OmpK36 is shown as a cartoon representation, with sulfate ions and methionine residues as sticks. Phased anomalous difference Fourier maps for BphA4 and OmpK36 are drawn in magenta and contoured at 5 σ.

