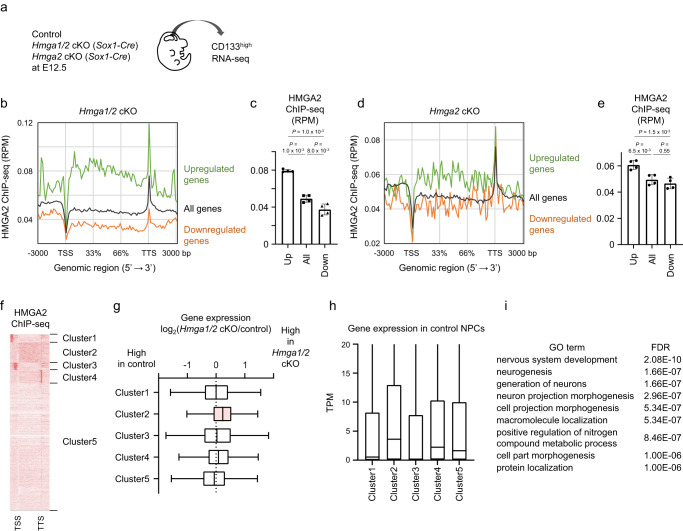
Fig. 5. Gene body localization of HMGA2 is associated with gene repression.
a RNA isolated from CD133high NPCs derived from the neocortex of control, Hmga2 cKO, or Hmga1/2 cKO mice at E12.5 was subjected to RNA-seq analysis. b Representative plot of averaged HMGA2 ChIP-seq signals around the gene body of all genes (black), genes upregulated by Hmga1/2 cKO (green, 1266 genes), and genes downregulated by Hmga1/2 cKO (orange, 1826 genes). TSS, transcription start site; TTS, transcription termination site. c Average signals at the gene body were calculated for each gene set in (b). Data are means ± s.d. (n = 4 independent experiments). Tukey’s multiple comparison test. d Representative plot of averaged HMGA2 ChIP-seq signals around the gene body of all genes (black), genes upregulated by Hmga2 cKO (green, 518 genes), and genes downregulated by Hmga2 cKO (orange, 341 genes). e Average signals at the gene body were calculated for each gene set in (d). Data are mean ± s.d. (n = 4 independent experiments). Tukey’s multiple comparison test. f HMGA2 binding patterns were clustered by ngsplot (k-means clustering, k = 5). The HMGA2 ChIP-seq signals ranging from 3000 bp upstream of the TSS to 3000 bp downstream of the TTS are shown as a heat map. g Differences in gene expression for each cluster between neocortical NPCs of Hmga1/2 cKO mice and those of control mice. Data are presented as box plots, with the boxes representing the median and upper and lower quartiles and the whiskers indicating the range (n = 3 independent experiments). h Gene expression levels (TPM, transcripts per million) for each cluster in neocortical NPCs of control mice. Data are presented as box plots, with the boxes representing the median and upper and lower quartiles and the whiskers indicating the range (n = 3 independent experiments). i Gene ontology analysis of upregulated in Hmga1/2 cKO mice.

