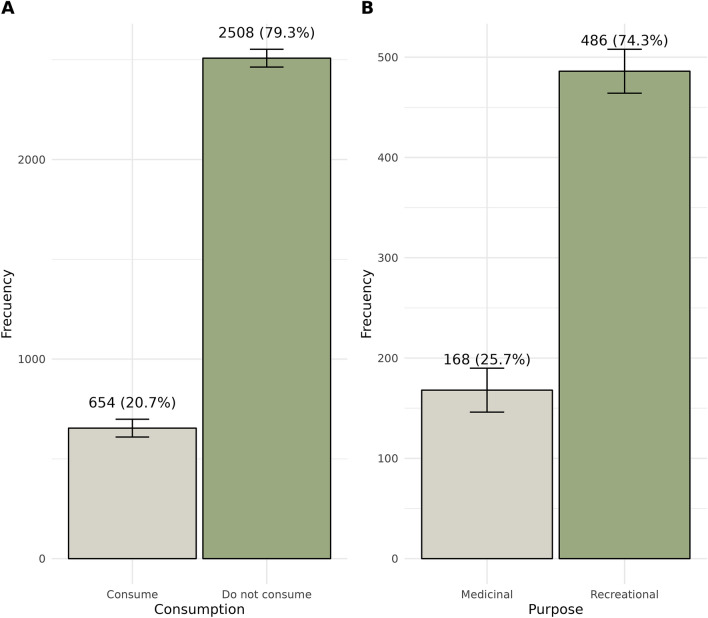
Figure 2.
Comparative bar charts illustrating consumption patterns and purposes. The left panel (A) depicts the frequency of individuals who consume versus those who do not consume. The right panel (B) differentiates between recreational and medicinal usage. Each bar represents the frequency of respondents, with annotations indicating the exact count and corresponding percentage. Error bars denote the 95% confidence intervals for each proportion.

