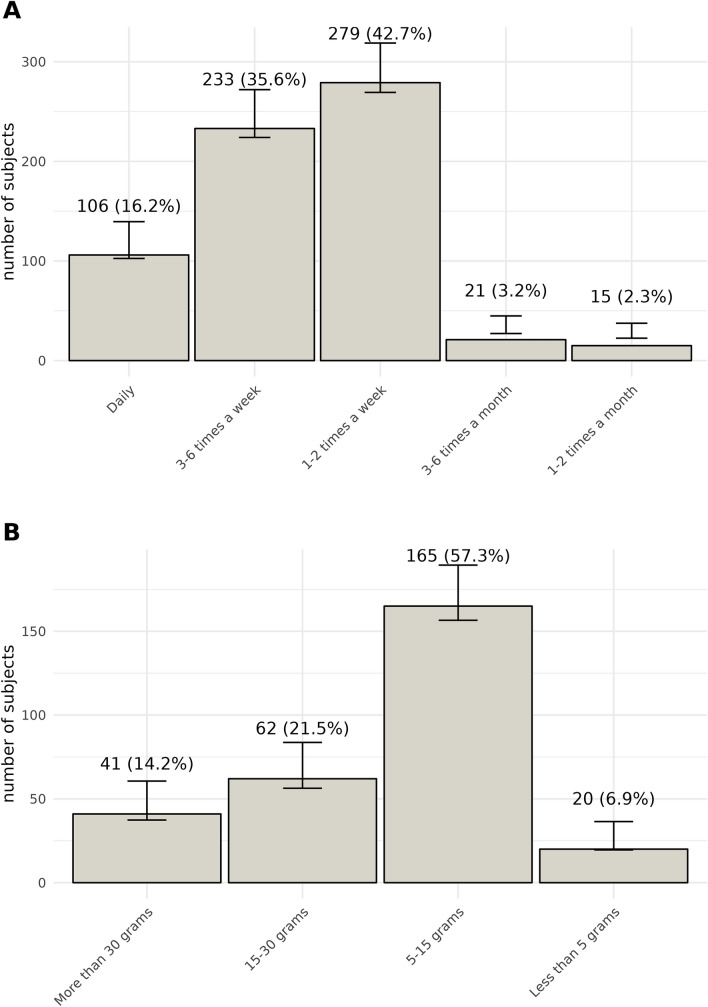
Figure 3.
Consumption patterns of study population. This figure presents two bar charts illustrating the frequency and quantity of consumption. (A) shows the frequency of consumption, with categories ranging from "Daily" to "1–2 times a month". (B) represents the quantity consumed, with categories from "More than 30 g" to "Less than 5 g". Each bar in both charts represents the number of subjects, with annotations indicating the exact count and corresponding percentage. The error bars denote the 95% confidence intervals for each proportion.

