FIGURE 1.
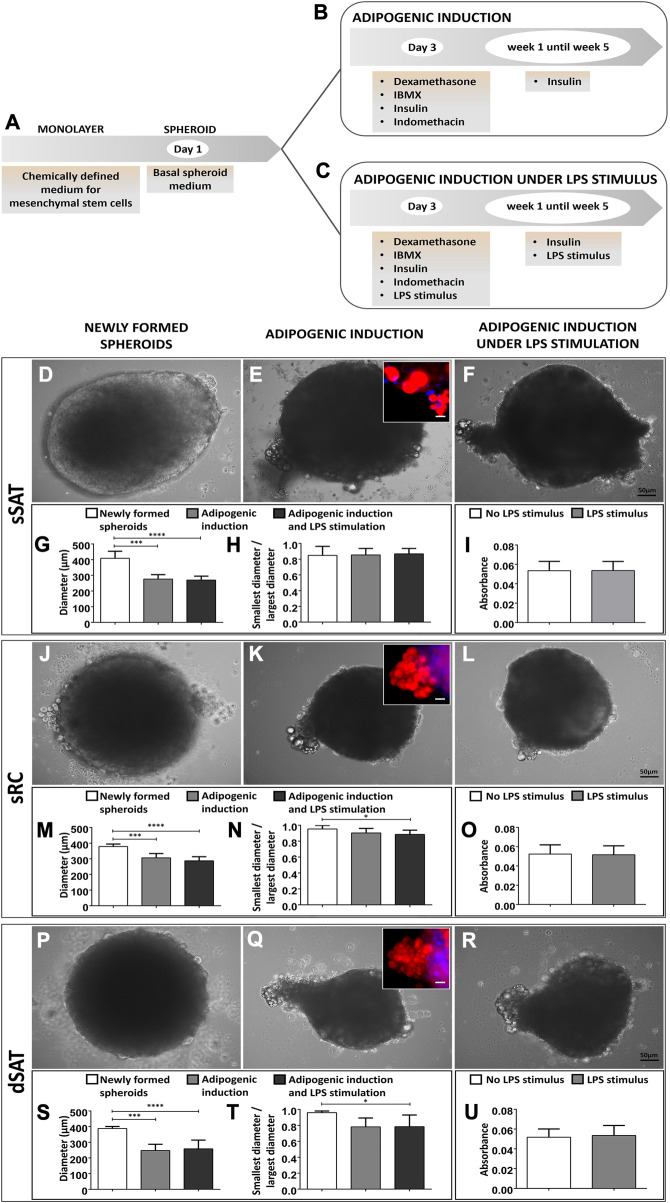
Induced ASC spheroids in the presence or absence of LPS stimulus showed lipid-accumulating cells migrating outside spheroids. Illustrative scheme of the stages of cell seeding and adipogenic induction (A–C). Newly formed spheroids from sSAT presented lateralized morphology, distinct from sRC and dSAT (D,J,P). Induced ASC spheroids and induced ASC spheroids under LPS stimulus at week 5 from sSAT, sRC, and dSAT showed a cell population migrating outside spheroids, resulting in a protuberance in their structure (E,K,Q,F,L,R). Nile red staining revealed the presence of lipid droplets in this cell population (insets). Induced ASC spheroids in the presence or absence of LPS stimulus from sSAT, sRC, and dSAT showed similar values for this test. Two independent analyses were evaluated with a total of 324 spheroids of each sample obtained from four independent experiments. The graph measuring the diameter of the spheroids of sSAT (G), sRC (M), and dSAT (S). Graph of the ratio between the minor and major diameters of the sSAT (H), sRC (N), and dSAT (T). Induced ASC spheroids from sSAT, sRC, and dSAT showed similar levels of LDH in the absence or presence of LPS (I,O,U), revealing no cytotoxic effects for this pro-inflammatory stimulus. (*p < 0.05; **p < 0.001; ***p < 0.001; ****p < 0.0001). SAT, Subcutaneous adipose tissue; ASC, Stem/stromal cells from adipose tissue. Bar size: 50 μm.

