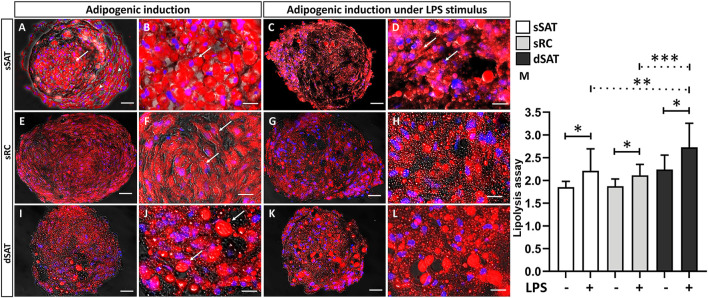
FIGURE 2.
Induced ASC spheroids from sSAT showed the highest adipogenic capacity and from dSAT the highest lipolytic capacity. Induced ASC spheroids from sSAT showed a more evident presence of unilocular cells in the center of the spheroids (arrow) and more elongated cells in the periphery (arrowhead) (A,B). Induced ASC spheroids from sSAT under LPS showed no difference in cell morphology (C,D). Induced ASC spheroids from sRC (E,F) and dSAT (I,J) and under LPS from sRC (G,H) and dSAT (K,L) showed similar lipid accumulation. Nile red and Hoechst nuclei staining. Bar size: 50 μm. The ANOVA test evaluated the difference between the sSAT, sRC, and dSAT spheroids within each group: adipogenic induction in the absence or presence of LPS (M). Three independent analyses in triplicate were evaluated with a total of 81 spheroids of each condition of each sample obtained from three independent experiments. Dashed lines indicate post-test analyses under both conditions. Solid lines indicate t-test analyses, which were performed to verify the statistical difference between induced ASC spheroids in the absence and in the presence of LPS from sSAT, sRC, and dSAT. Asterisks indicate p-values obtained in the post-test and in the t-test (*p < 0.05; **p < 0.001; *** p < 0.001). SAT, subcutaneous adipose tissue; LPS, lipopolysaccharide; ASC, stem/stromal cells from adipose tissue.

