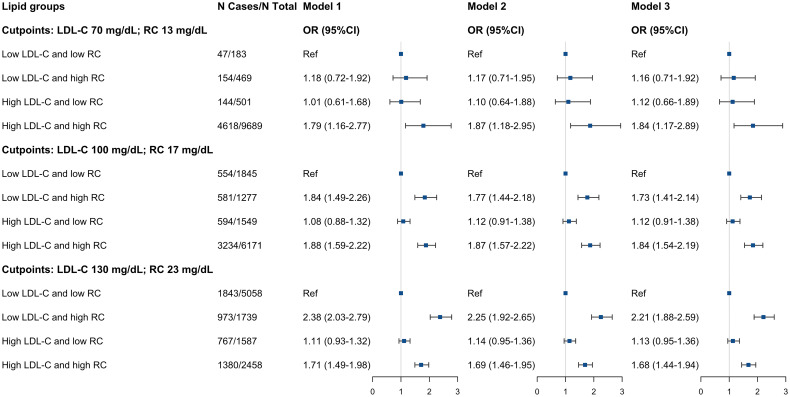
Figure 3.
Adjusted ORs (95%CIs) of hypertension according to different concordant/discordant groups by LDL-C clinical cut-points (70, 100, and 130 mg/dL) and percentile-equivalents for RC in the NHANES 1999 to 2018. Model 1: adjusted for age (continuous), sex (male/female), race/ethnicity (non-Hispanic white, non-Hispanic black, Mexican American, other), educational level (less than high school, high school or equivalent, college or above), family income-poverty ratio (≤1.0, 1.1-3.0, >3.0), smoking status (never smoker, former smoker, current smoker), and alcohol drinking (non-drinker, low to moderate drinker, heavy drinker). Model 2: further adjusted (from Model 1) for chronic kidney disease (yes or no), diabetes mellitus (yes or no), and coronary heart disease (yes or no). Model 3: further adjusted (from Model 2) for eGFR (continuous), FBG (continuous), and HbA1c (continuous). Squares represent odds ratios and solid black lines indicate 95% confidence intervals. All estimates accounted for complex survey design. OR, odds ratio; CI, confidence interval; LDL-C, low-density lipoprotein cholesterol; RC, remnant cholesterol.

