. 2023 Jul 25;29(20):4166–4177. doi: 10.1158/1078-0432.CCR-23-0956

Figure 1.

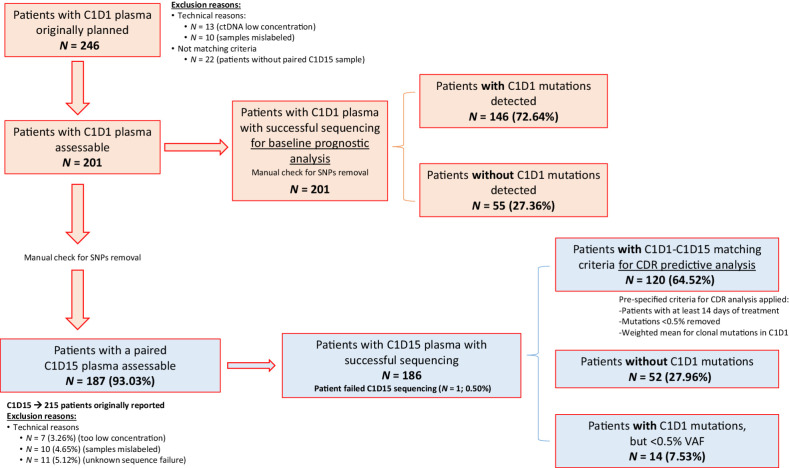
Figure 1. CONSORT diagram of the study population and samples. Blood samples were collected for ctDNA analysis from -7 days to C1D1 for baseline prognostic analysis and C1D15 when available. A total of 246 different patients with C1D1 were considered. 13 patients had DNA concentrations too low (under 0.10 ng/μL) so were excluded. From remaining 233, 22 did not have an additional follow-up sample at C1D15 to have a paired analysis, so were also excluded. From remaining 211, 10 samples were excluded as result of mislabeling during aliquoting, resulting in a total of 201 final different patients included in the analysis, all with a baseline and at least 1 follow-up sample.

CONSORT diagram of the study population and samples. Blood samples were collected for ctDNA analysis from -7 days to C1D1 for baseline prognostic analysis and C1D15 when available. A total of 246 different patients with C1D1 were considered. 13 patients had DNA concentrations too low (under 0.10 ng/μL) so were excluded. From remaining 233, 22 did not have an additional follow-up sample at C1D15 to have a paired analysis, so were also excluded. From remaining 211, 10 samples were excluded as result of mislabeling during aliquoting, resulting in a total of 201 final different patients included in the analysis, all with a baseline and at least 1 follow-up sample.