. 2023 Jul 25;29(20):4166–4177. doi: 10.1158/1078-0432.CCR-23-0956

Figure 2.

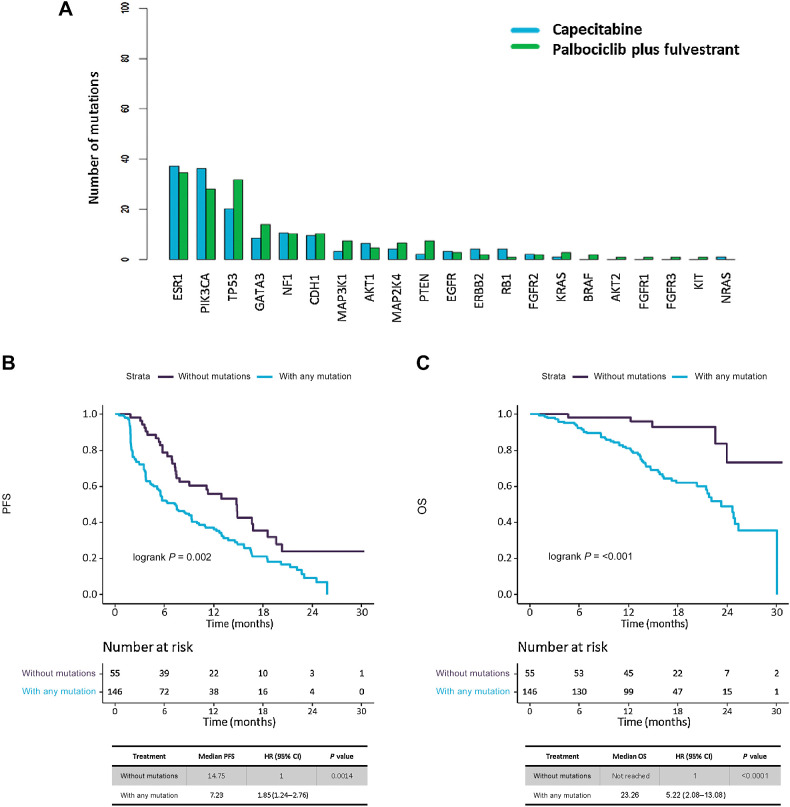
Figure 2. Mutation distribution across study population, and analysis of ctDNA detection effect in survival. A, Bar plot showing distribution of mutations in study population, by mutated genes and treatment arms. B and C, Kaplan–Meier survival curves, including risk table (time in months, m), to measure presence of any mutation (ctDNA detection) effect in survival, among patients with and without any mutation detected. B, PFS, and (C) OS.

Mutation distribution across study population, and analysis of ctDNA detection effect in survival. A, Bar plot showing distribution of mutations in study population, by mutated genes and treatment arms. B and C, Kaplan–Meier survival curves, including risk table (time in months, m), to measure presence of any mutation (ctDNA detection) effect in survival, among patients with and without any mutation detected. B, PFS, and (C) OS.