. 2023 Jul 25;29(20):4166–4177. doi: 10.1158/1078-0432.CCR-23-0956

Figure 3.

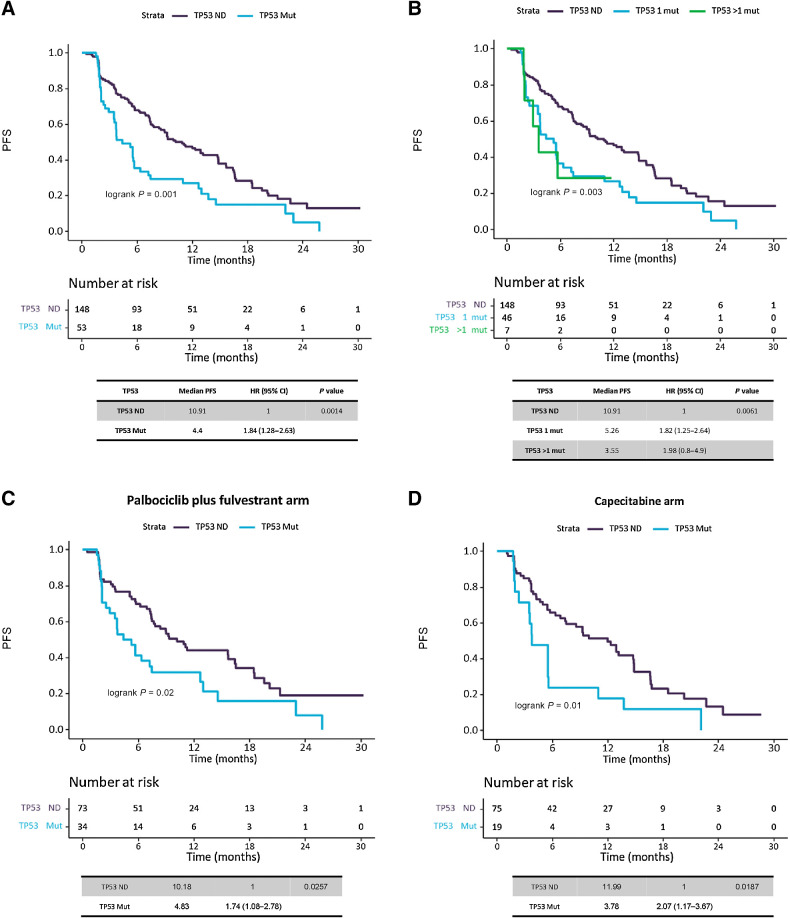
Figure 3. Analysis of TP53 mutation effect in PFS. Kaplan–Meier survival curves, including risk table (time in months, m), to measure the effect of TP53 mutations in PFS. A, Survival analysis on TP53 gene mutations, regardless treatment, by presence/absence of mutations. B, Survival analysis on TP53 gene mutations, regardless treatment, by number of mutations (0 mutations, 1 mutation or more than 1 mutations). C, Survival analysis on TP53 gene mutations, in palbociclib plus fulvestrant treated patients, by presence/absence of mutations. D, Survival analysis on TP53 gene mutations, in capecitabine treated patients, by presence/absence of mutations.

Analysis of TP53 mutation effect in PFS. Kaplan–Meier survival curves, including risk table (time in months, m), to measure the effect of TP53 mutations in PFS. A, Survival analysis on TP53 gene mutations, regardless treatment, by presence/absence of mutations. B, Survival analysis on TP53 gene mutations, regardless treatment, by number of mutations (0 mutations, 1 mutation or more than 1 mutations). C, Survival analysis on TP53 gene mutations, in palbociclib plus fulvestrant treated patients, by presence/absence of mutations. D, Survival analysis on TP53 gene mutations, in capecitabine treated patients, by presence/absence of mutations.