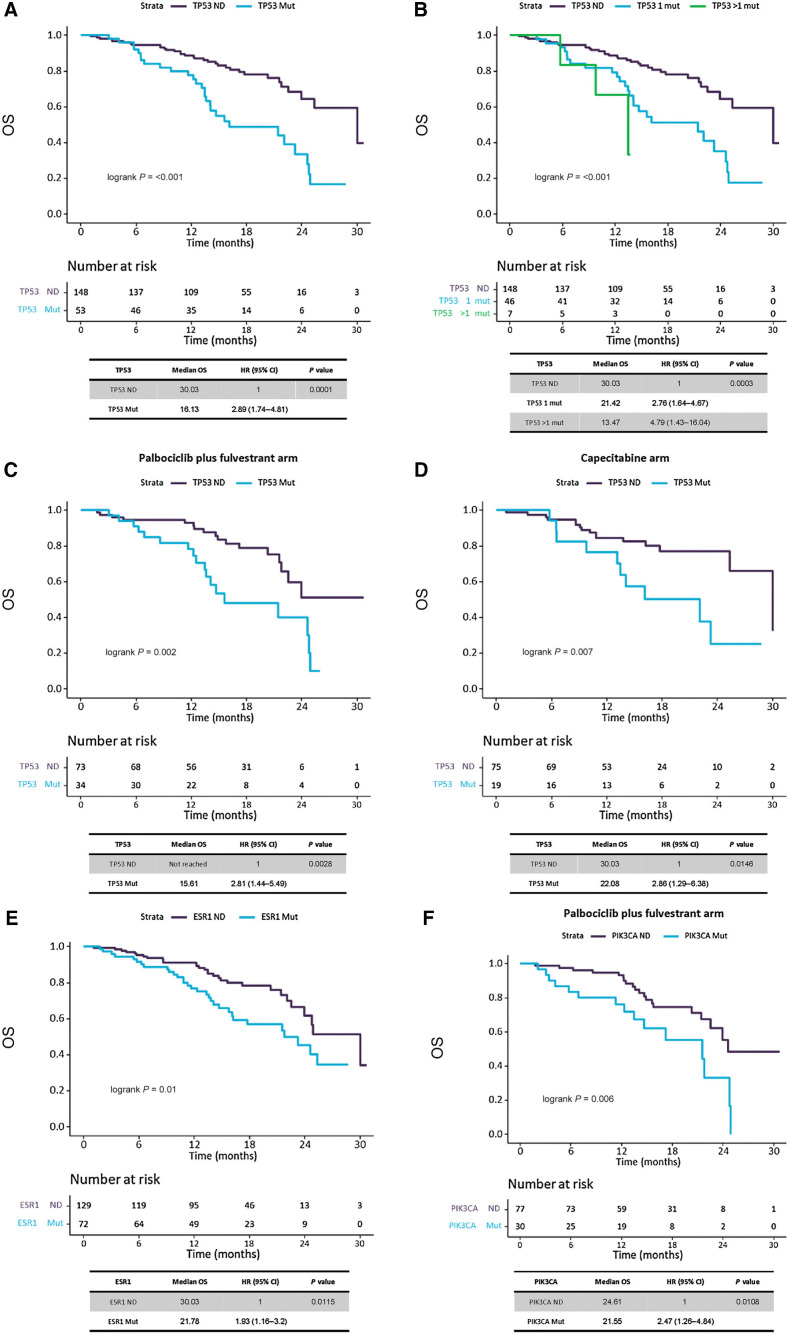
Figure 4.
Analysis of TP53, ESR1 and PIK3CA mutation effect in OS. Kaplan–Meier survival curves, including risk table (time in months, m), to measure the effect of TP53 mutations in OS. A, Survival analysis on TP53 gene mutations, regardless treatment, by presence/absence of mutations. B, Survival analysis on TP53 gene mutations, regardless treatment, by number of mutations (0 mutations, 1 mutation or more than 1 mutations). C, Survival analysis on TP53 gene mutations, in palbociclib plus fulvestrant treated patients, by presence/absence of mutations. D, Survival analysis on TP53 gene mutations, in capecitabine treated patients, by presence/absence of mutations. E, Survival analysis on ESR1 gene mutations, regardless treatment, by presence/absence of mutations. F, Survival analysis on PIK3CA gene mutations, in palbociclib plus fulvestrant treated patients, by presence/absence of mutations.

