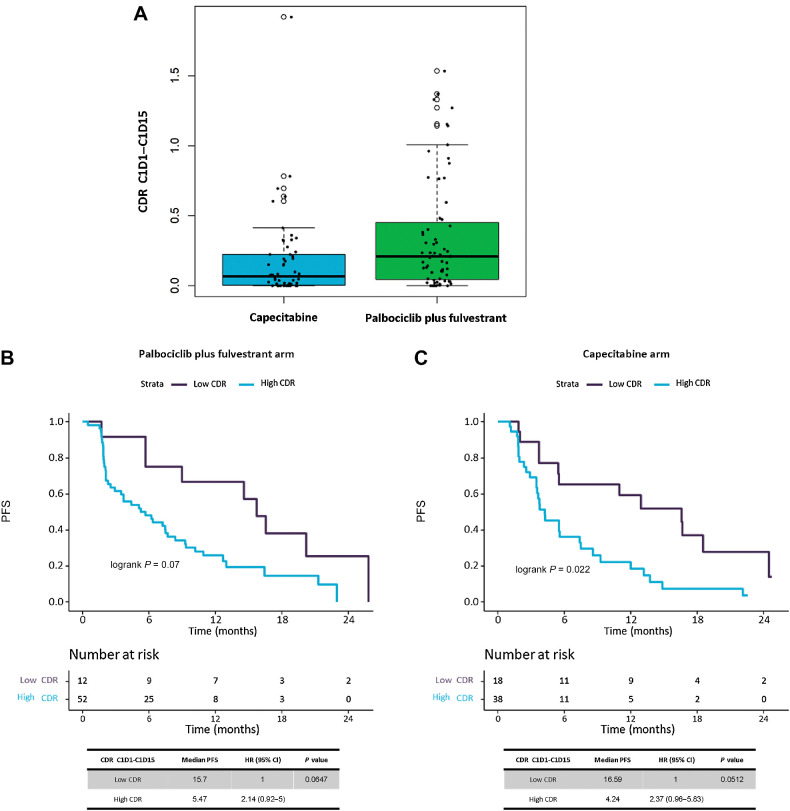
Figure 5.
Longitudinal predictive ctDNA analysis by use of median CDR methodology, calculated at C1D15 timepoint. A, Boxplot graph showing distribution of CDR C1D15 values in patients by treatment arms, palbociclib plus fulvestrant vs. capecitabine. B and C, Kaplan–Meier survival curves, including risk table (time in months, m), to measure the effect of CDR (Low vs. High) in PFS by treatment arm, (B) in palbociclib plus fulvestrant treated patients and (C) in capecitabine treated patients. Median CDR between C1D15–C1D1, calculated with prespecified methodology, offered a CDR value optimal cutoff of 0.0247 for palbociclib plus fulvestrant arm, while it was of 0.0127 for the capecitabine treatment arm. Those optimal cut-off values were used to create Low versus High CDR groups, in both treatment arms.

