. 2023 Jul 27;29(20):4256–4267. doi: 10.1158/1078-0432.CCR-23-0538

Figure 1.

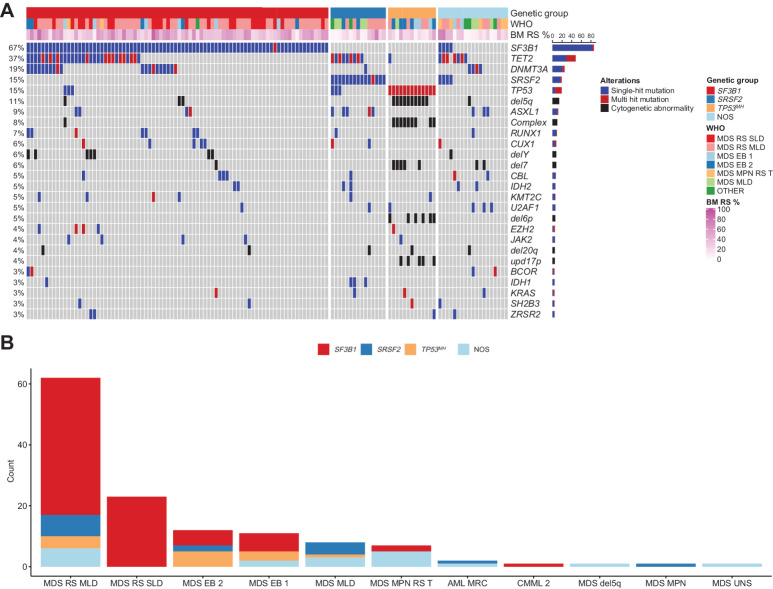
Figure 1. Mutational landscape of MDSRS+. A, Mutation profile displaying clusters identified by unsupervised clustering analysis in MDSRS+. Genetic aberrations and somatic mutations with prevalence >2% are shown. Genes having ≥2 distinct mutations or one mutation associated with chromosomal alterations of the same gene locus are labeled as multihit and distinguished by single-mutation. Genetic subgroup, WHO subtypes, and BM RS percentage (BM RS %) are shown above the heatmap. B, Distribution of genetic classes across WHO categories of the MDSRS+. Complex, complex karyotype; del, deletion; mh, multihit; upd, uniparental disomy.

Mutational landscape of MDSRS+. A, Mutation profile displaying clusters identified by unsupervised clustering analysis in MDSRS+. Genetic aberrations and somatic mutations with prevalence >2% are shown. Genes having ≥2 distinct mutations or one mutation associated with chromosomal alterations of the same gene locus are labeled as multihit and distinguished by single-mutation. Genetic subgroup, WHO subtypes, and BM RS percentage (BM RS %) are shown above the heatmap. B, Distribution of genetic classes across WHO categories of the MDSRS+. Complex, complex karyotype; del, deletion; mh, multihit; upd, uniparental disomy.