. 2023 Jul 27;29(20):4256–4267. doi: 10.1158/1078-0432.CCR-23-0538

Figure 2.

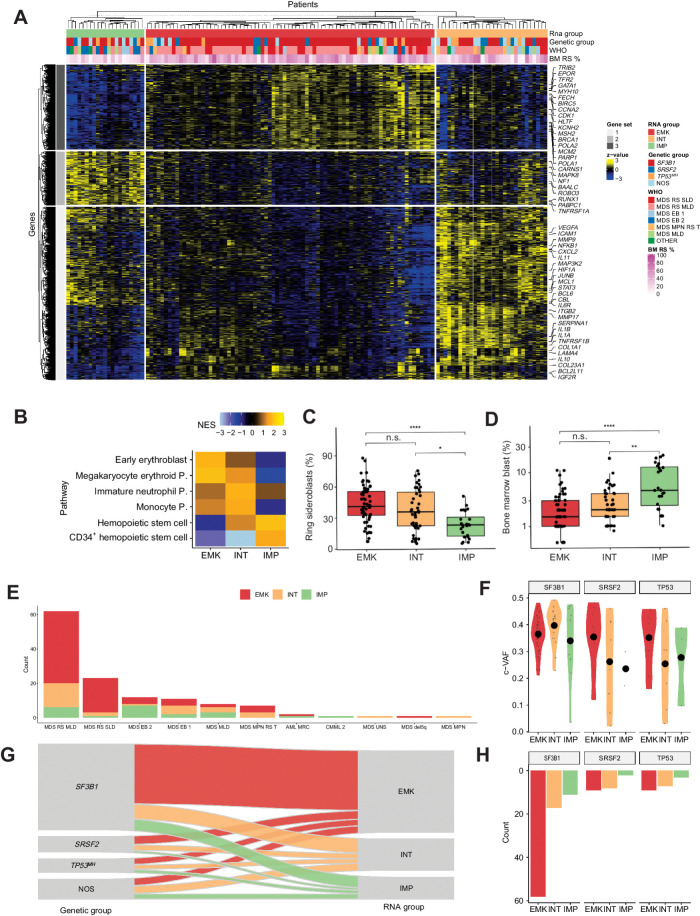
Figure 2. Transcriptomic landscape of MDSRS+. A, Heat map showing expression levels of differentially expressed genes in MDSRS+ across the three transcriptomic groups. Rows represent genes and samples are depicted in columns. Covariates display gene expression–based group, genetic group, WHO subtypes and BM RS %. B, GSEA on DEGs among the three clusters. Normalized enrichment score (NES) was computed considering the comparison between each group and NBM used as controls. P, progenitor. C–D, Comparison of BM RS (C) and blasts (D) distributions across the three groups derived from gene expression unsupervised clustering analysis. E, Frequency distribution of transcriptomic classes across WHO categories of the MDSRS+ cohort. F, Distribution of variant allele frequency (VAF) corrected by CNV/LOH (c-VAF) of SF3B1, SRSF2, and TP53MH, stratified by gene expression groups. Specifically, in case of deletion or LOH, VAF was halved to making it comparable with mutation without CNV/LOH. In case of multiple TP53 mutations, TP53MH c-VAF referred to the second-ranked TP53 mutation VAF. G, Sankey diagram showing the relationship between genomic and transcriptomic classification. Color labels distinguish cases according to the three gene expression groups. H, Absolute frequency distribution of SF3B1, SRSF2, and TP53MH mutation, stratified by gene expression group.

Transcriptomic landscape of MDSRS+. A, Heat map showing expression levels of differentially expressed genes in MDSRS+ across the three transcriptomic groups. Rows represent genes and samples are depicted in columns. Covariates display gene expression–based group, genetic group, WHO subtypes and BM RS %. B, GSEA on DEGs among the three clusters. Normalized enrichment score (NES) was computed considering the comparison between each group and NBM used as controls. P, progenitor. CD, Comparison of BM RS (C) and blasts (D) distributions across the three groups derived from gene expression unsupervised clustering analysis. E, Frequency distribution of transcriptomic classes across WHO categories of the MDSRS+ cohort. F, Distribution of variant allele frequency (VAF) corrected by CNV/LOH (c-VAF) of SF3B1, SRSF2, and TP53MH, stratified by gene expression groups. Specifically, in case of deletion or LOH, VAF was halved to making it comparable with mutation without CNV/LOH. In case of multiple TP53 mutations, TP53MH c-VAF referred to the second-ranked TP53 mutation VAF. G, Sankey diagram showing the relationship between genomic and transcriptomic classification. Color labels distinguish cases according to the three gene expression groups. H, Absolute frequency distribution of SF3B1, SRSF2, and TP53MH mutation, stratified by gene expression group.