. 2023 Jul 27;29(20):4256–4267. doi: 10.1158/1078-0432.CCR-23-0538

Figure 5.

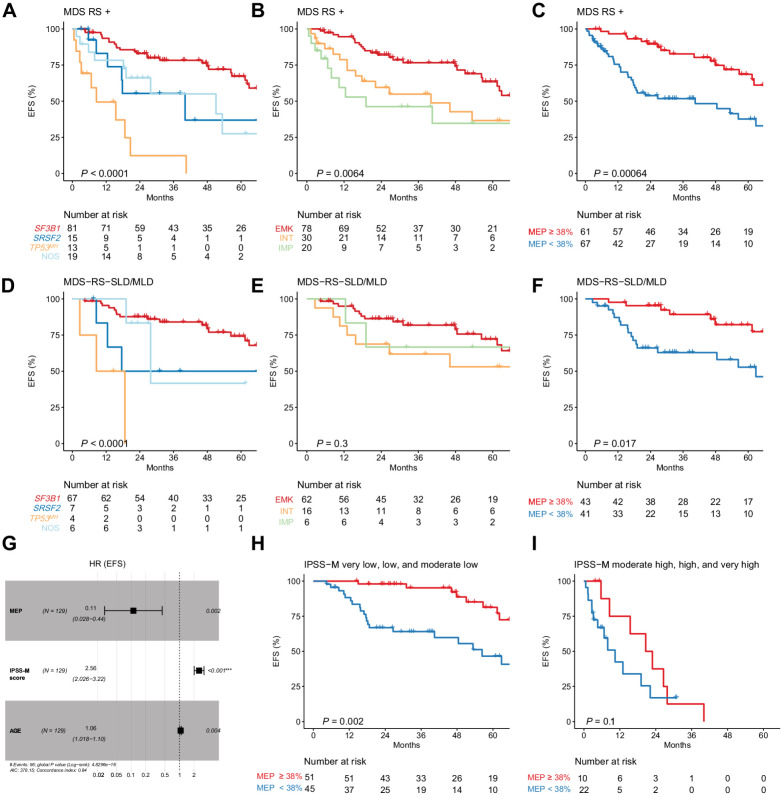
Figure 5. Prognostic effect of genomic and transcriptomic analyses on MDSRS+ outcome. EFS stratified by genomic (A), transcriptomic classification (B), and estimated MEP percentage (C) in all MDSRS+ (A–C) and MDS-RS-SLD/MLD only (D–F). Multivariable Cox proportional hazard model for EFS in all MDSRS+ including age, IPSS-M score, and estimated MEP percentage as continuous variables (G). EFS stratified by estimated MEP percentage and IPSS-M risk category (H and I) (full representation of the six IPSS-M categories shown in Supplementary Fig. S21A).

Prognostic effect of genomic and transcriptomic analyses on MDSRS+ outcome. EFS stratified by genomic (A), transcriptomic classification (B), and estimated MEP percentage (C) in all MDSRS+ (AC) and MDS-RS-SLD/MLD only (DF). Multivariable Cox proportional hazard model for EFS in all MDSRS+ including age, IPSS-M score, and estimated MEP percentage as continuous variables (G). EFS stratified by estimated MEP percentage and IPSS-M risk category (H and I) (full representation of the six IPSS-M categories shown in Supplementary Fig. S21A).