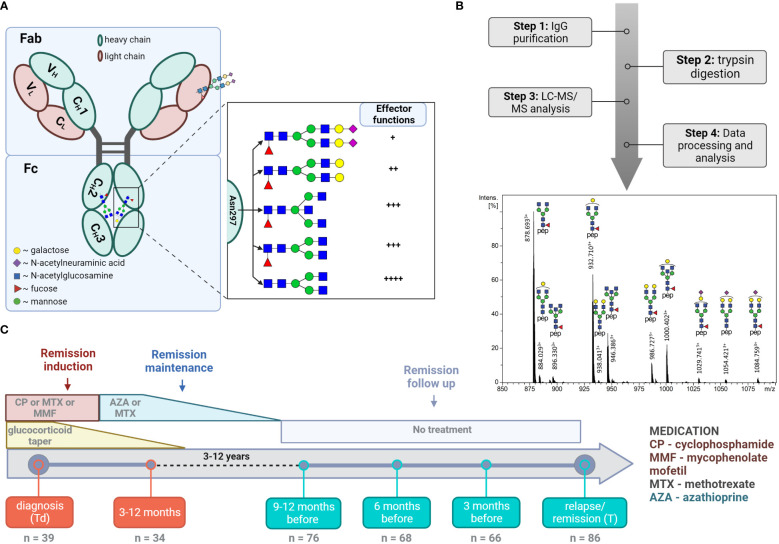
Figure 1.
LC-MS analysis of total IgG Fc-glycopeptides. (A) Schematic representation of IgG N-glycosylation. The left side depicts IgG with the heavy γ chains (H) and light chains (L) composed of constant (CH1, CH2, CH3, CL) and variable domains (VH, VL). The right side depicts the glycan features covalently attached to Asparagine 297 (Asn 297) and their implications on subsequent cellular effector functions mediated by binding to Fc receptors. (B) Schematic workflow with a representative LC-MS summed mass spectrum of IgG1 tryptic glycopeptides obtained from a 60 year-old female at the point of relapse. (C) Timeline of the study cohort. The analysed time points and number of samples analysed at each time point are specified. The major treatment regime applied in the current study is shown (10).

