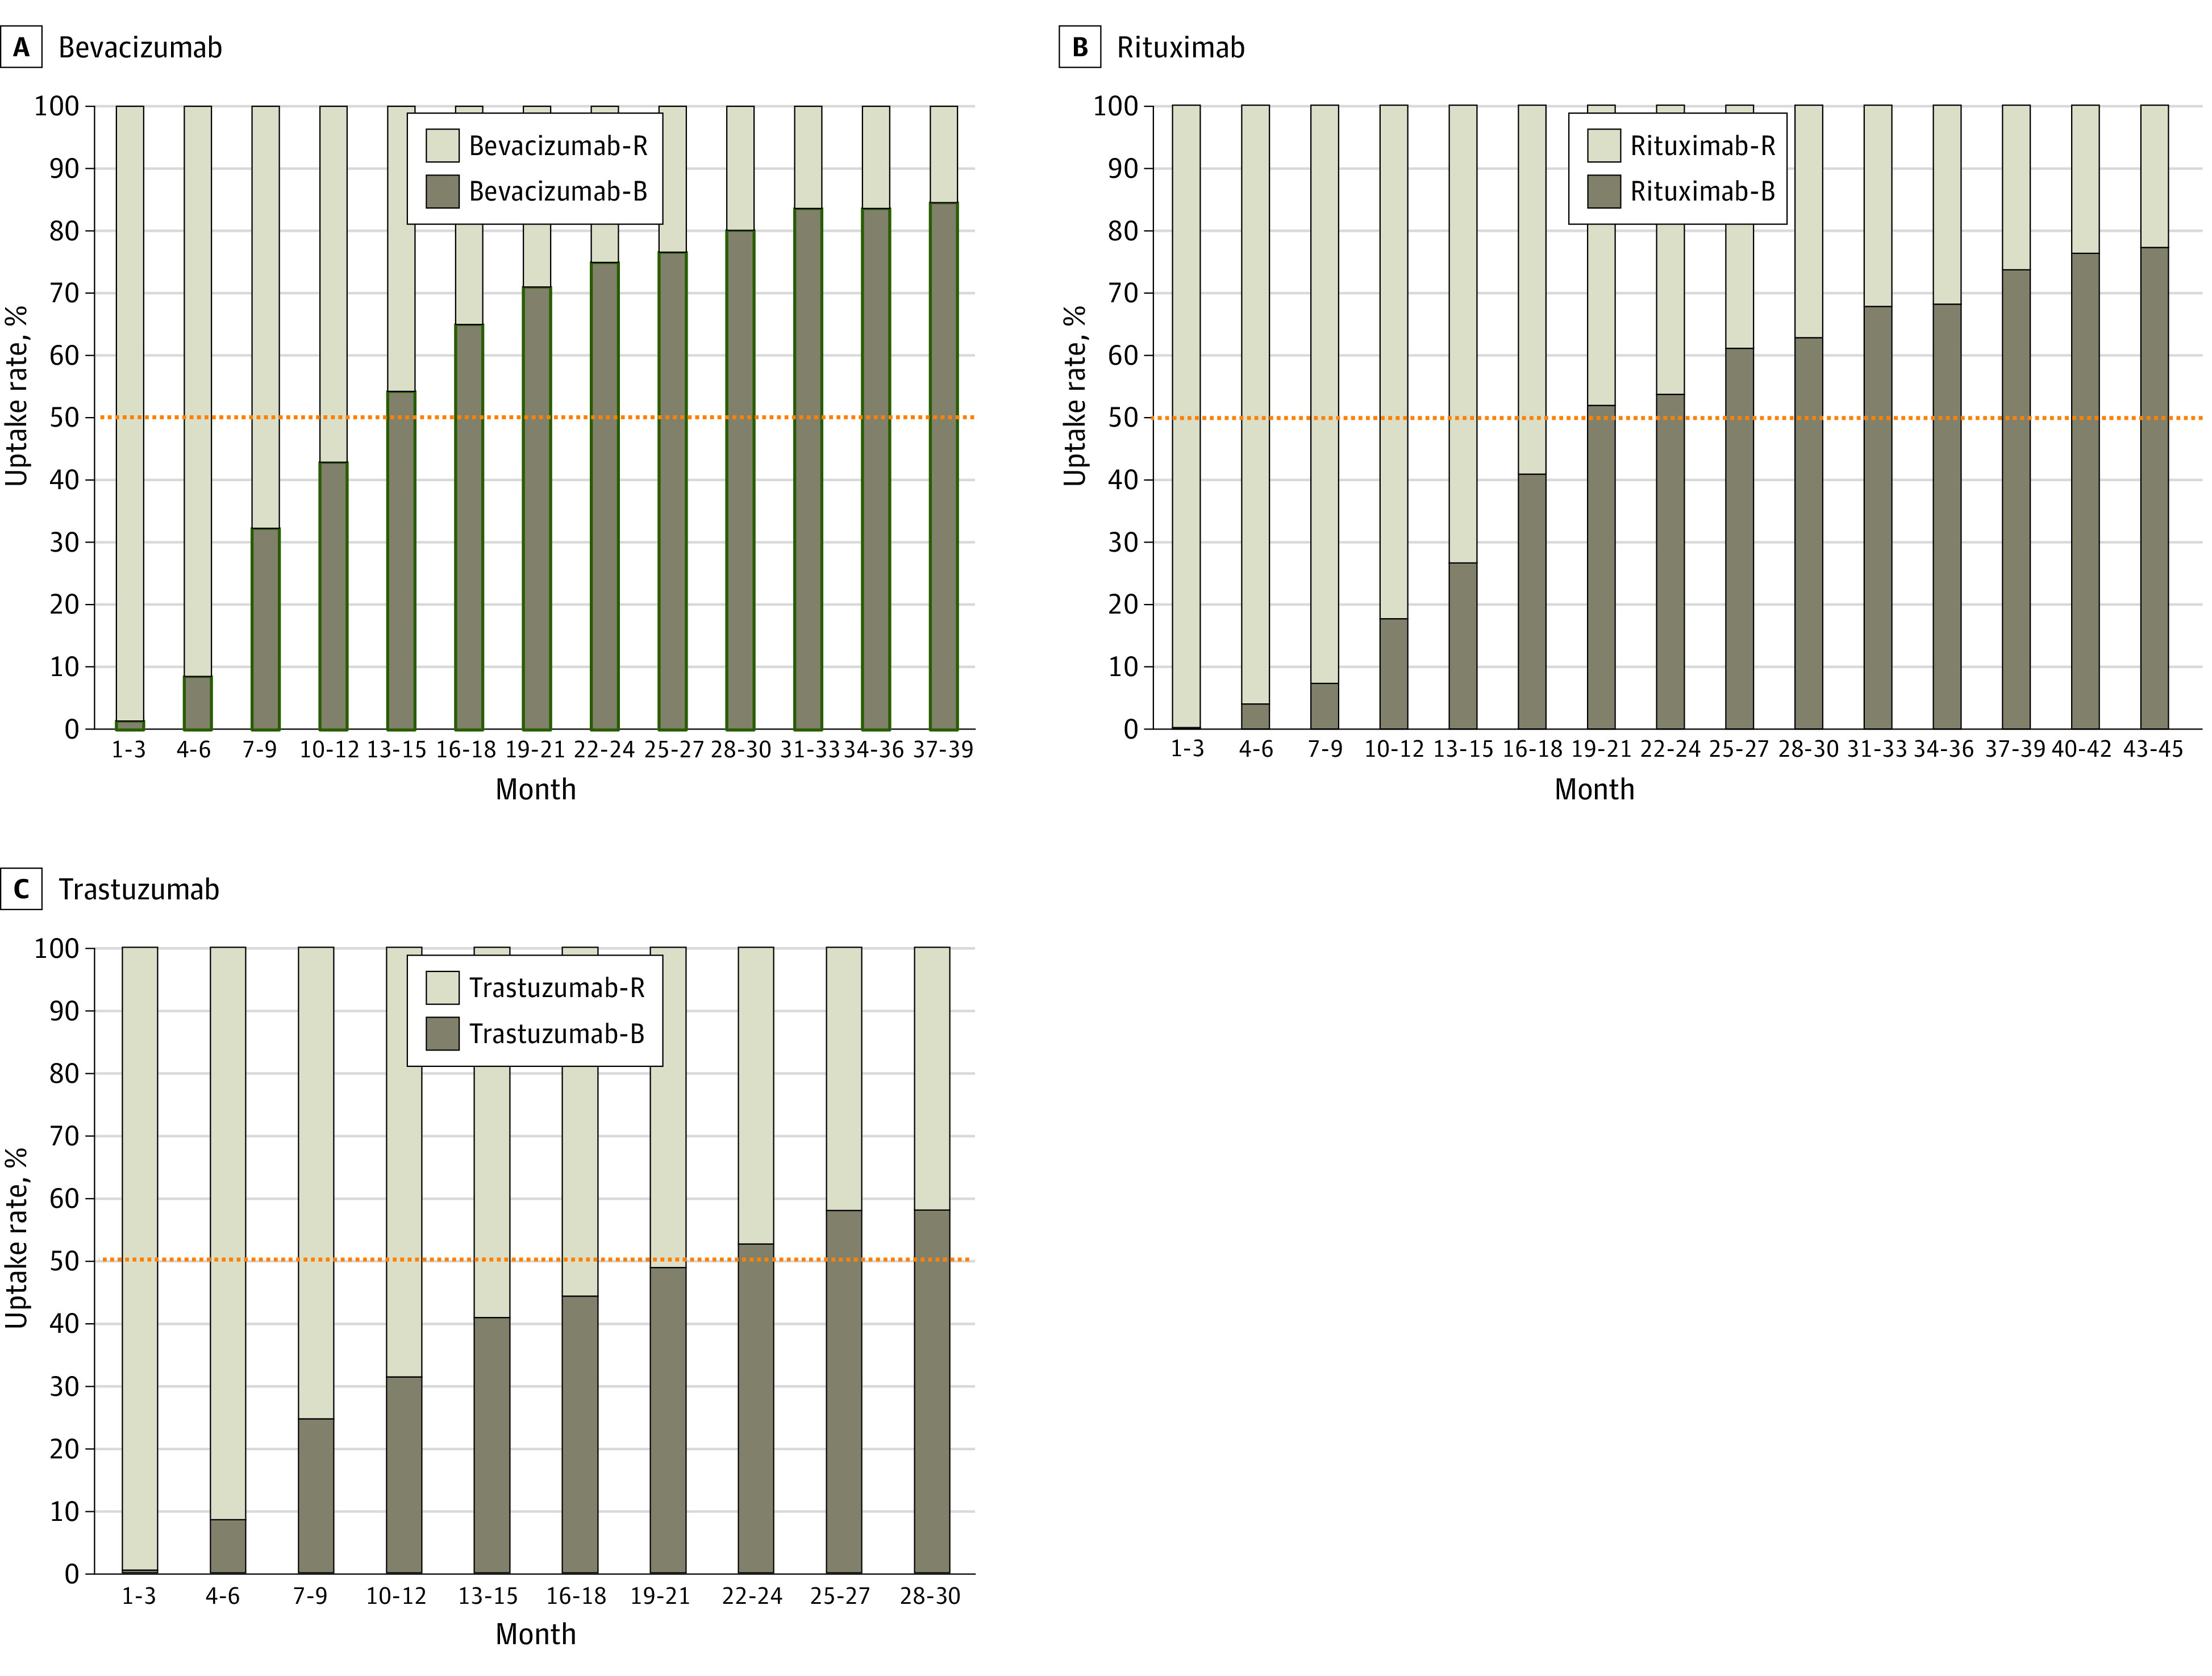
Figure 2. Trends in the Uptake Rate of Rituximab, Bevacizumab, and Trastuzumab Biosimilars vs Reference Drugs After Market Entry.

The x-axis represents the time since the biosimilar was introduced to the market. The y-axis represents the uptake rates of biosimilars vs their reference drugs per quarter. Bevacizumab biosimilars and rituximab biosimilars were launched for sale in 2019, whereas trastuzumab biosimilar was launched for sale in 2020. The cutoff date for price uptake rates of biosimilars was December 31, 2022. The annual uptake rate for biosimilars is calculated by dividing the 1-year sales of biosimilars by the 1-year sales of their reference drugs. Orange dotted lines represent a 50% uptake rate of biosimilars vs reference drugs. B indicates biosimilar; R, reference.
