
Figure 7.
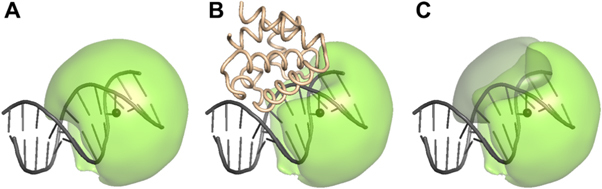
Choosing the labelling site for the PIFE experiment. As an example, the binding reaction of a 93-residue bacterial DNA-binding protein domain (brown) to DNA (grey) is shown. The snapshot of the DNA-protein complex is generated by CafeMol, a coarse-grained simulation package[123]. (A) The AV of the dye in a free or ‘reference’ state is displayed by the green surface, while the dye attachment site (dT) on the DNA is indicated by the inner dark sphere. (B) The AV of dye in the bound or ‘PIFE’ state is reduced by the presence of the bound protein, which will likely result in detectable PIFE. (C) The comparison between the AV of the free and bound states (cf. panels A and B) reveals a volume difference of 23% - represented by the grey surface.