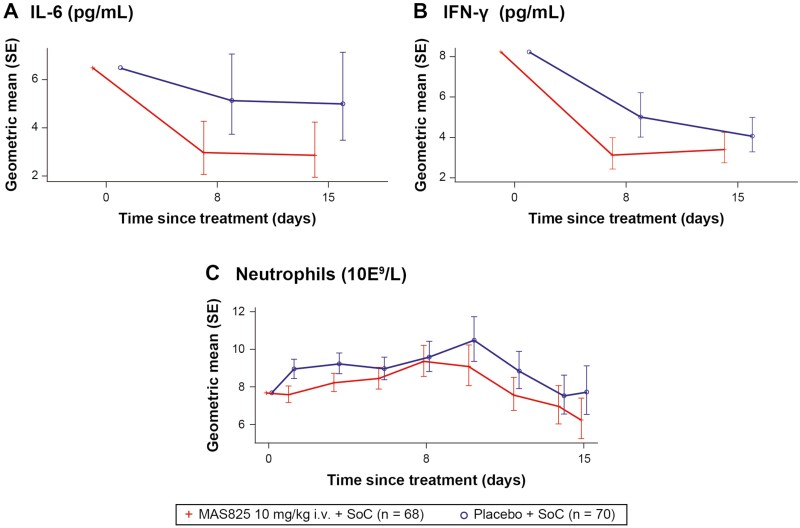
Figure 6.
Analysis of IL-6, neutrophils, and IFN-γ in COVID-19 patients receiving MAS825 + SoC versus placebo during treatment period (PD analysis set). Data presented as estimated geometric mean ± SE. Biomarker data was reported as concentration results defined by the lower limit of quantification (LLOQ) and upper limit of quantification (ULOQ). Values that fell below the LLOQ and ULOQ were reported as <LLOQ * dilution factor. Parameters with values below the LLOQ are imputed as LLOQ/2 and values above the ULOQ are imputed as ULOQ. Biomarker parameters were analyzed by MRMM. Log-transformed biomarker data is modeled using mixed-effects model with treatment, visit, stratification factors, visit * treatment, and visit * stratification factors as fixed effects and log-transformed baseline score and visit * log-transformed baseline score as continuous covariate. Stratification factors = age group, administration of any anti-viral therapy, presence of comorbidities. Results were back transformed to obtain adjusted geometric mean, geometric mean ratio, and 90% CI. COVID-19: coronavirus disease-19; IFN-γ: interferon gamma; IL-6: interleukin-6; i.v.: intravenous; MMRM: mixed-effect repeated measures; SoC: standard of care.

