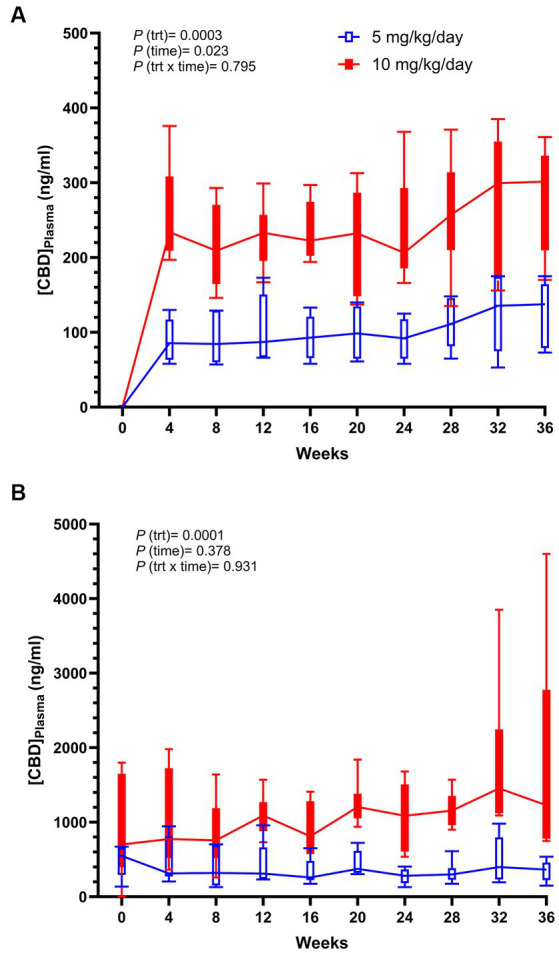
Figure 2.

Box plots of trough (0 h) (A) and peak (2 h) (B) plasma CBD measured over time of dogs supplemented daily with 10 mg/kg CBD (solid red) and 5 mg/kg CBD (unfilled blue). p-values reported include treatment (trt), time, and treatment by time (trt x time).
