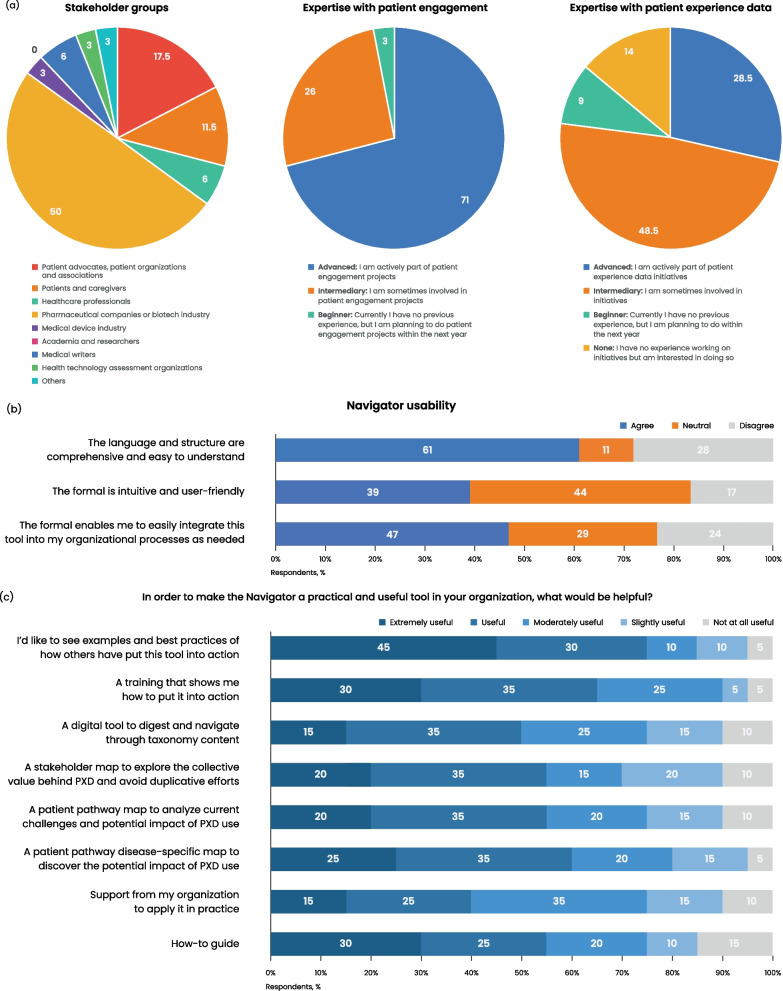
Fig. 4.
Results of the public consultation survey. a Respondent demographics shown as a percentage of respondents in terms of stakeholder groups represented, expertise with patient engagement, and expertise with patient experience data (N = 35). b Bar graph showing the results of the questions asked around usability of the Global Patient Experience Data Navigator. Respondents chose agree, neutral, or disagree in relation to the given statements (N = 18). c Bar graph showing respondents’ opinions regarding the relative usefulness of the Navigator for PXD initiatives (N = 20). d Bar graph showing respondents’ ranking of the relative value of ways to help make the Navigator a practical tool (N = 20). PXD patient experience data


