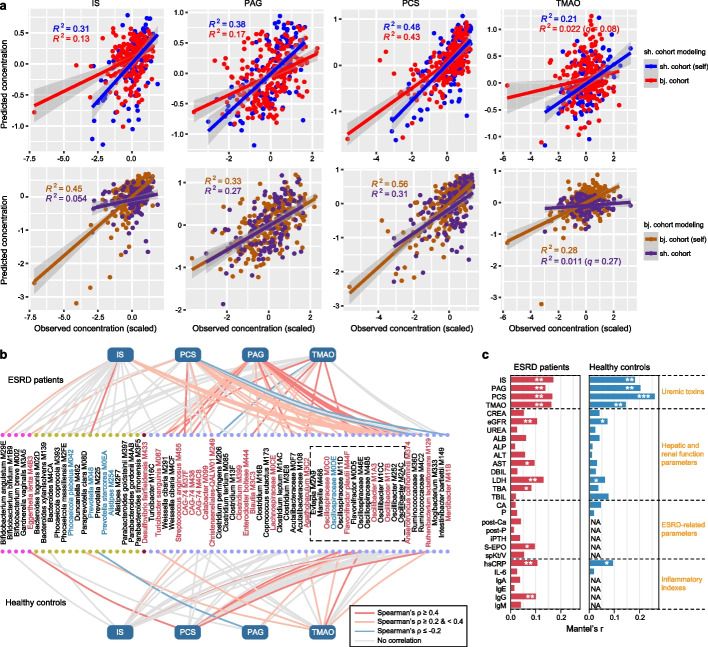
Fig. 4.
Gut microbiota-based prediction of the serum concentrations of uremic toxins. a Prediction of the serum concentrations of four toxins using gut microbiota-based model training with Shanghai individuals (upper panels) and Beijing individuals (bottom panels). For each model, 70% of the samples in one cohort were randomly selected as the training set, and the models were tested on the remaining 30% of the samples from the same cohort (self) or all samples from the other cohort. The X-axis and Y-axis show the predicted concentration and scaled measured concentration for each toxin, respectively. Smooth curves are formed using the geom_smooth function with the default parameters in the R ggplot2 package. b The 67 gut species with the highest contribution to serum toxin levels. Lines connect the species used in the prediction models for each toxin, with the line color representing the Spearman correlation coefficient between the measured toxin concentration and species abundance. The color of the species denotes their enrichment in ESRD patients (red) or healthy controls (blue), and a dotted box labels the species that belong to Oscillospiraceae. Colored dots denote the species’ phylum (from left to right: Actinobacteria, Bacteroides, Proteobacteria, and Firmicutes). c Correlation between the 67 toxin-contributing species and the clinical parameters. The bar lengths indicate Mantel’s r between the species abundance and each parameter, and the q-values are calculated based on the Mantel test with 9999 permutations: *q < 0.05; **q < 0.01; ***q < 0.001

