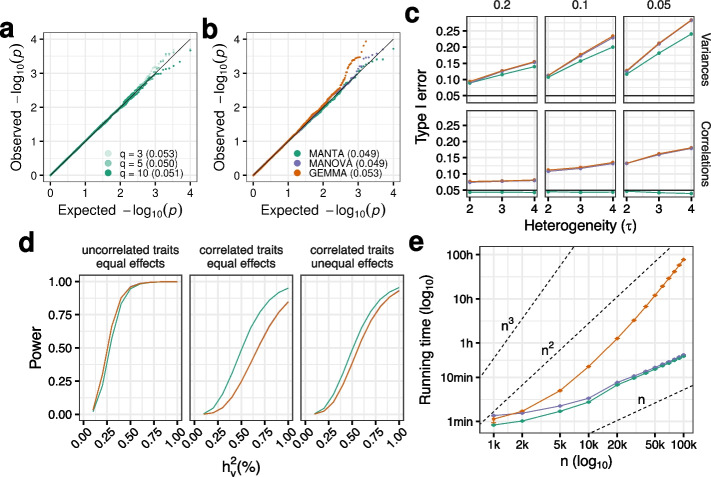
Fig. 2.
a QQ-plot of p values obtained with MANTA for 3, 5, and 10 traits simulated in unrelated individuals ( 1000). Type I errors are shown between parentheses. Simulation details: = 0.2, multivariate normal residuals. b QQ-plot of p values obtained with MANTA (green), MANOVA (purple) and GEMMA (orange) on the actual 1000 Genomes Project (1KGP) genotypes ( 2504), with 5 genotype principal components (PCs) included as covariates in the model (in the case of MANTA and MANOVA). Simulation details: 5, 0.2, multivariate normal residuals. Colors are maintained for c–e. c Type I error of the three methods when simulating binomial SNPs with a certain minimum allele frequency (MAF) and different degrees of heterogeneity (given by , see the “Methods” section) between genotype groups at the level of trait variances and correlations. d Power of the three methods as a function of the percentage of variance explained by the causal variant (), using the 1KGP genotypes, across different scenarios: the causal variant has equal effects on uncorrelated (left) and correlated (middle) traits, and unequal effects on correlated traits (right). Simulation details: actual 1KGP dataset ( 2504), 5 traits, 0.2, trait-to-trait correlation = 0 (left) and 0.5 (middle, right), effect size ratio = 1 (left, middle) and 2 (right), 5 genotype principal components (PCs) included as covariates in the model in the case of MANTA and MANOVA, Bonferroni corrected p values. e Empirical running time as a function of sample size (n) for the three methods. Each point corresponds to the mean running time across 5 runs with different input data (see the “Methods” section). Error bars represent the standard error of the mean (i.e., mean ± SEM). Axes are in scale. Dashed lines represent running time growth rates of n, , and

