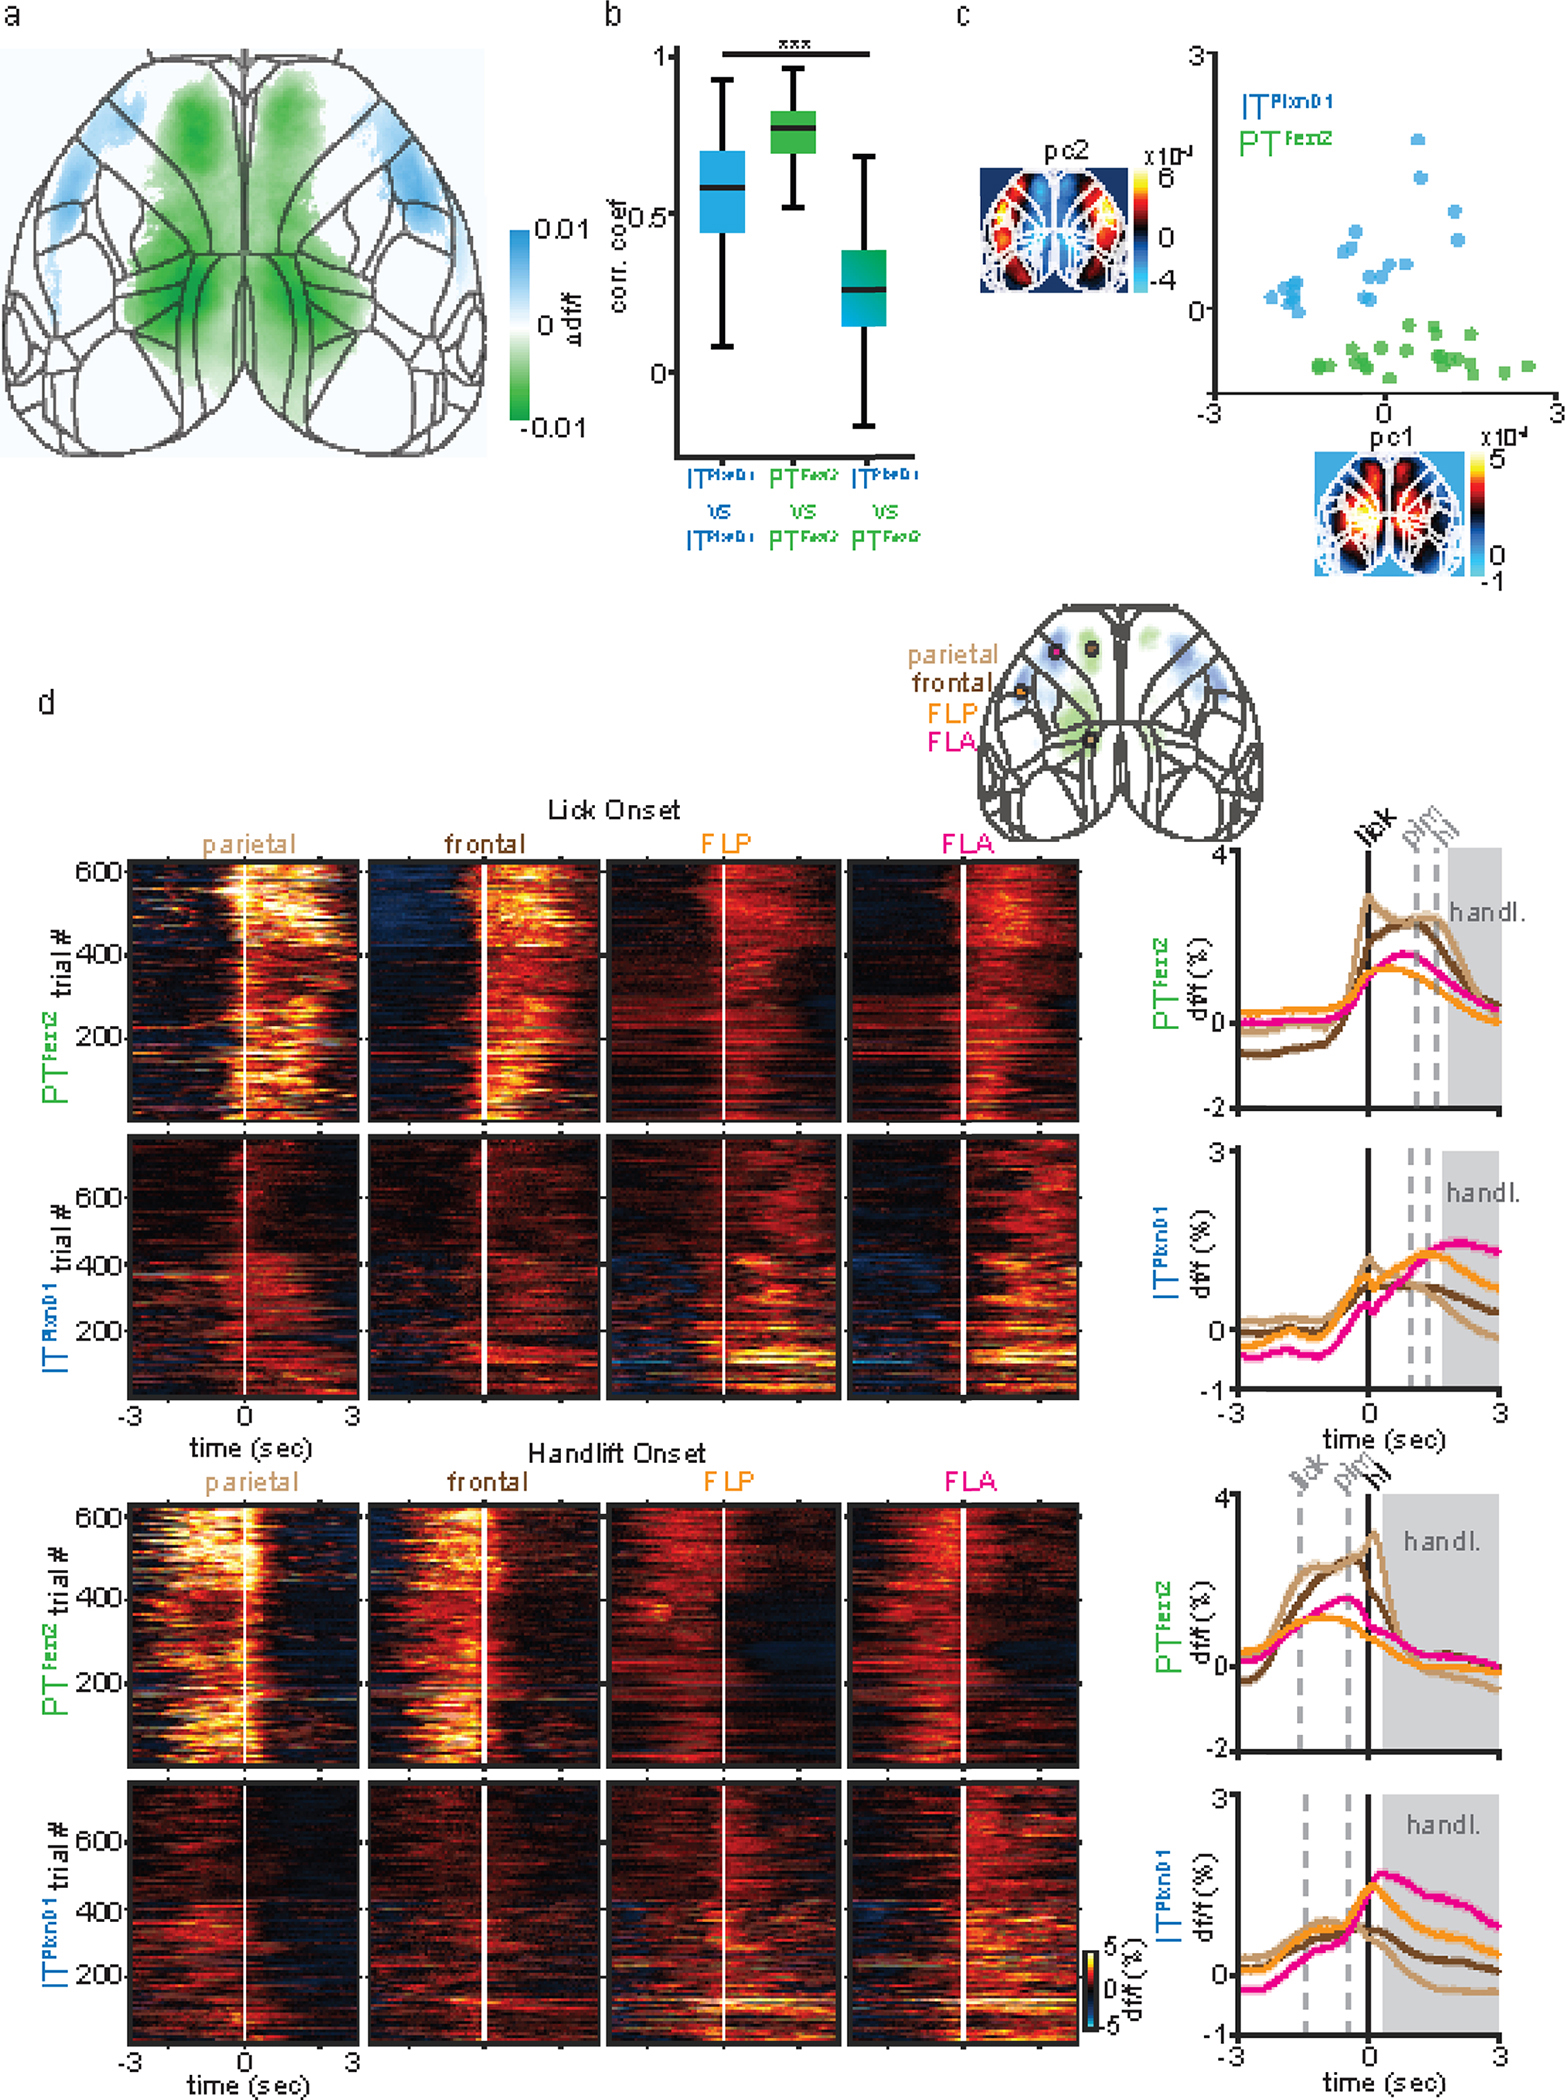
Extended Data 4. Temporal dynamics of ITPlxnD1 and PTFezf2 within parietofrontal and frontolateral networks centered to lick and hand lift onset.

a. Difference between ITPlxnD1 and PTFezf2 mean activity map from Fig 3a,d. Only significantly different pixels are displayed (two-sided Wilcoxon rank sum test with p-value adjusted by FDR = 0.05, n = 24 maps from ITPlxnD1 and 23 maps from PTFezf2). Blue pixels indicate values significantly larger in ITPlxnD1 compared to PTFezf2 and vice versa for green pixels.
b. Distribution of Pearson’s correlation coefficients within ITPlxnD1 (blue), PTFezf2 (green) and between ITPlxnD1 & PTFezf2 (blue green) mean feeding sequence activity maps (n = 253 pairs within ITPlxnD1, 276 pairs within PTFezf2 and 522 pairs between ITPlxnD1 & PTFezf2).
c. Distribution of ITPlxnD1 (blue) and PTFezf2 (green) mean feeding sequence activity maps projected to the subspace spanned by the top two principal components (n = 24 maps from ITPlxnD1 and 23 maps from PTFezf2).
d. Single trial heatmaps and mean activity of PTFezf2 and ITPlxnD1 from parietal, frontal, FLA and FLP centered to lick (top) and handlift onset (bottom, ITPlxnD1 - 23 sessions from 6 mice, PTFezf2 - 24 sessions from 5 mice, shaded region indicates ±2 s.e.m). ***p<0.0005. For box plots, central mark indicates median, bottom and top edges indicate 25th and 75th percentiles and the whiskers extend to extreme points excluding outliers (1.5 times more or less than the interquartile range). All statistics in Supplementary table 1.
