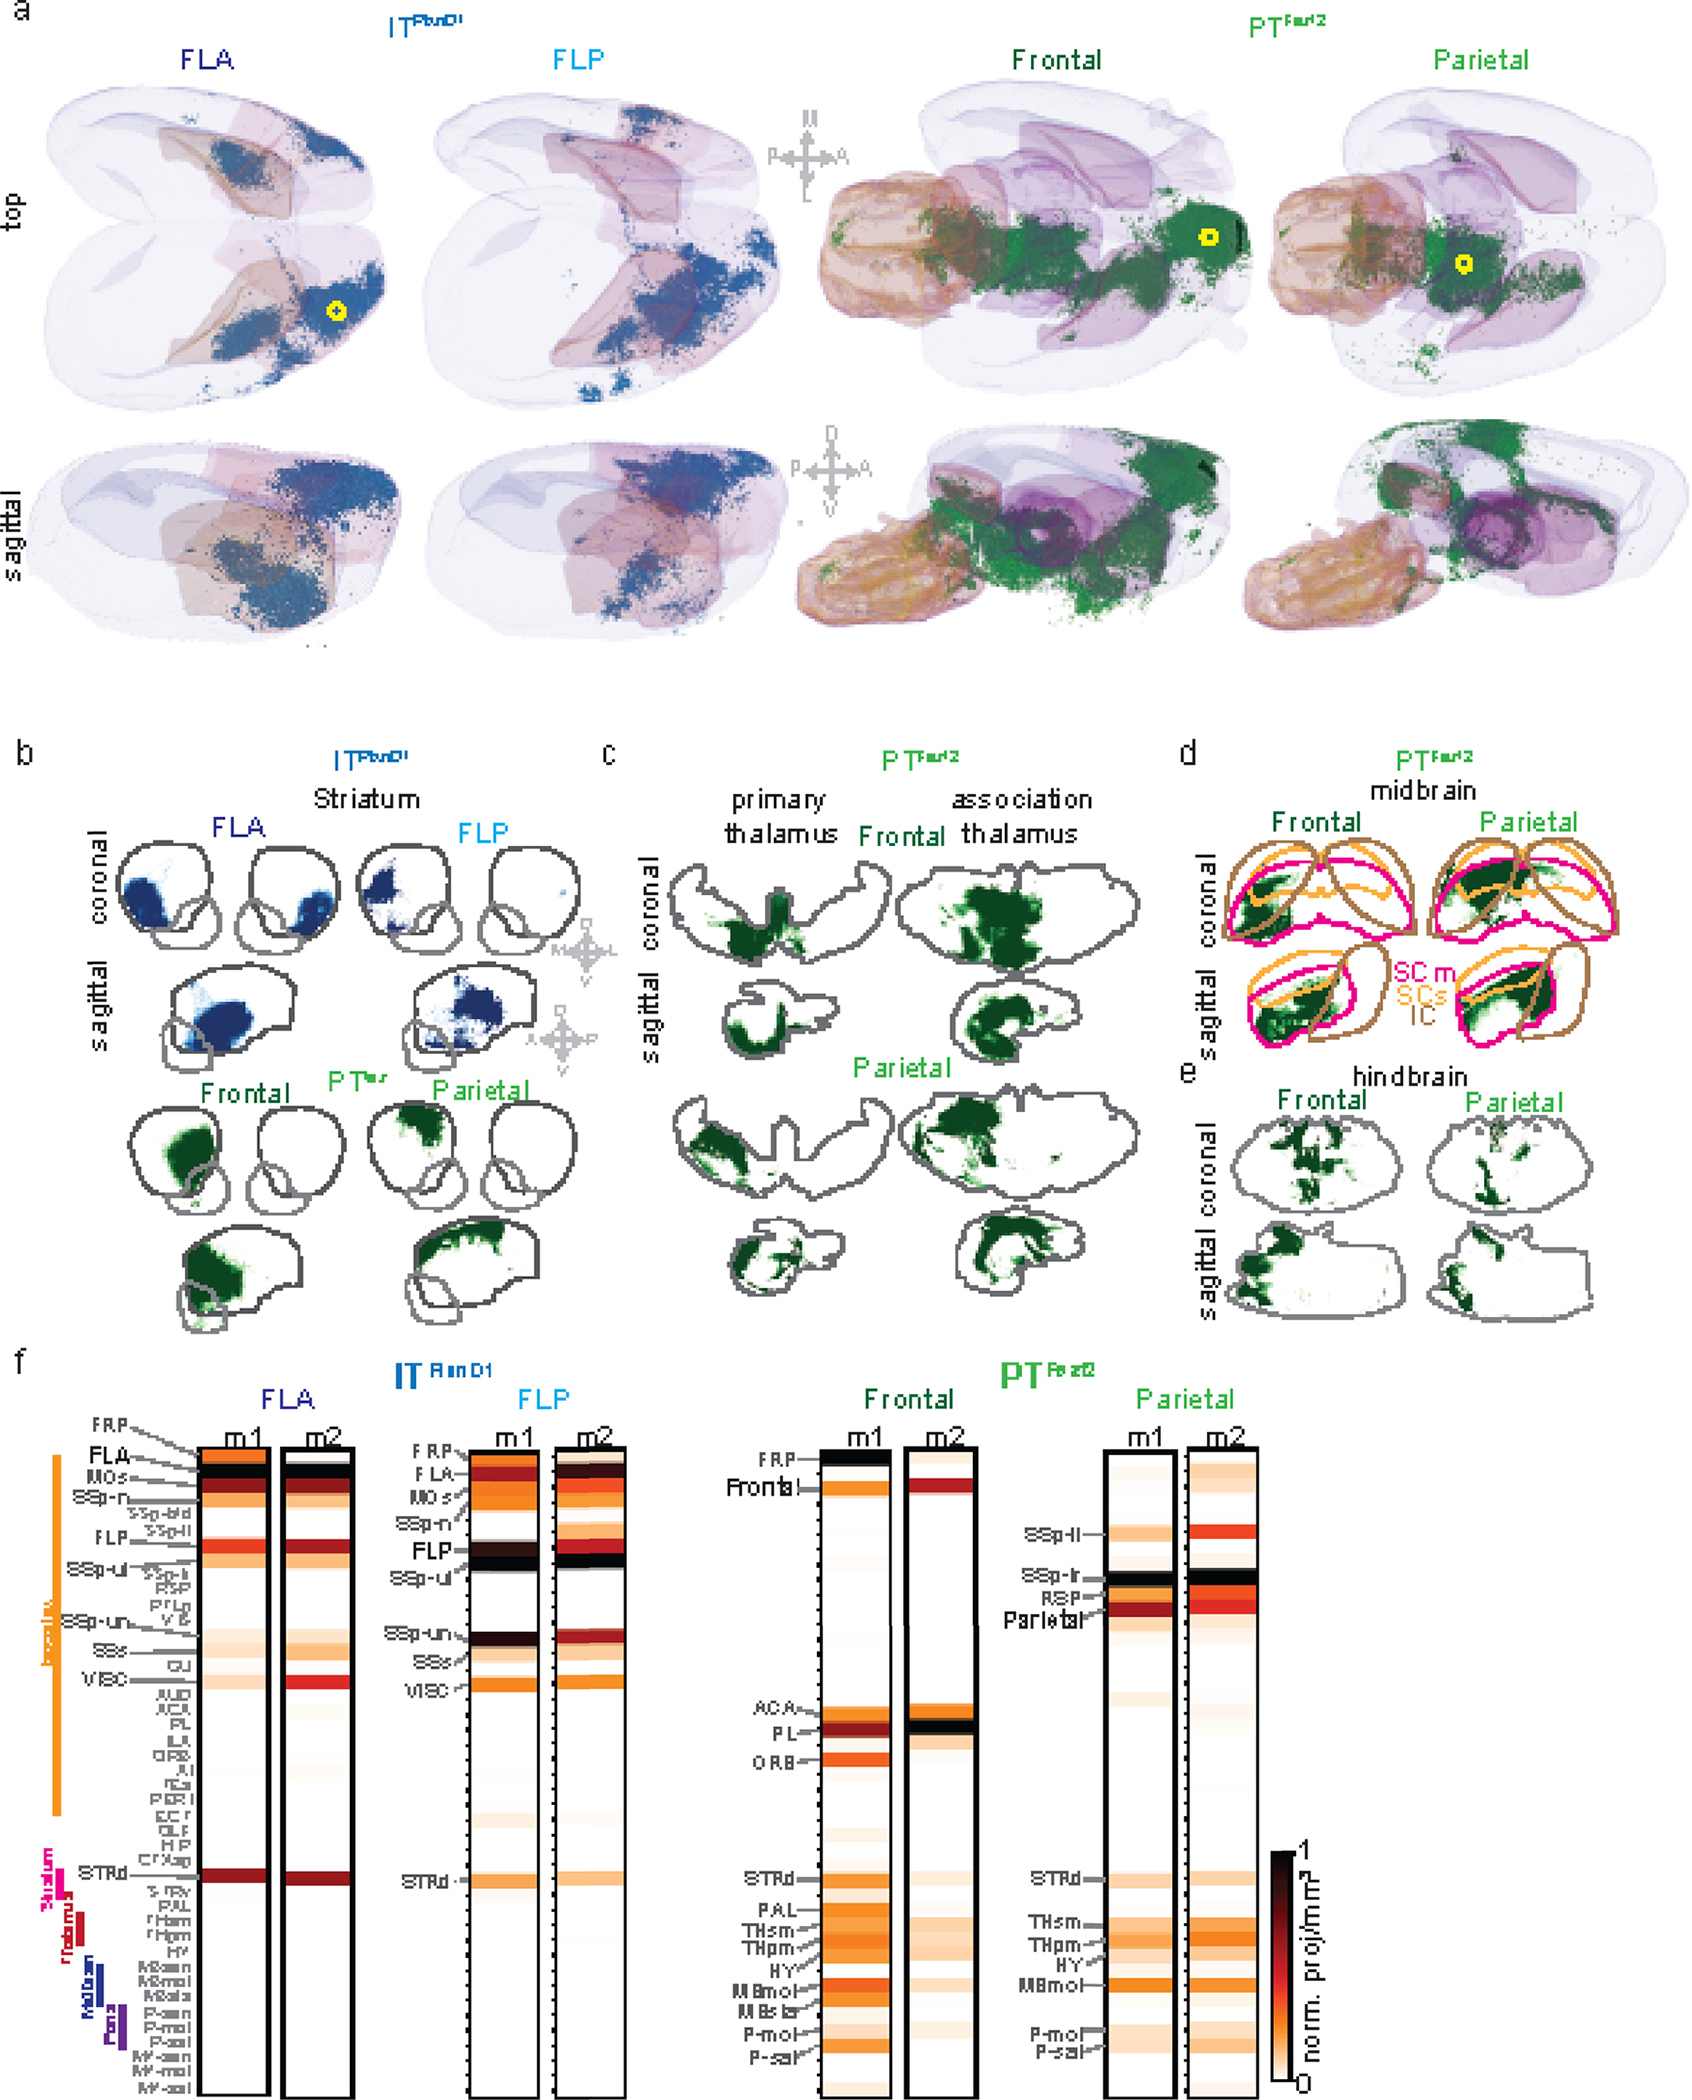
Extended Data 8. Axonal projection of ITPlxnD1 and PTFezf2 in subcortical structures.

a. Three dimensional rendering of axonal projections of ITPlxnD1 from FLA and FLP and PTFezf2 from frontal and parietal node. Yellow circle indicates injection site.
b. Spatial distribution of axonal projections of ITPlxnD1 from FLA and FLP (top) and PTFezf2 parietal and frontal nodes (bottom) within the striatum projected onto the coronal and sagittal plane.
c. Spatial distribution of axonal projections of PTFezf2 from parietal and frontal nodes within the primary and association thalamus projected onto the coronal and sagittal plane.
d. Spatial distribution of axonal projections of PTFezf2 from parietal and frontal nodes within the motor Superior colliculus (SCm, magenta), sensory superior colliculus (SCs, yellow) and inferior colliculus (IC, brown) projected onto the coronal and sagittal plane.
e. Spatial distribution of axonal projections of PTFezf2 from parietal and frontal nodes (bottom) within the hindbrain projected onto the coronal and sagittal plane.
f. Brain-wide volume and peak normalized projection intensity maps of ITPlxnD1 from FLA and FLP and PTFezf2 from frontal and parietal nodes from two mice. Black font indicates injection site; larger gray font indicates regions with significant projections; smaller gray font indicates regions analyzed.
