
Extended Data 10. Spatiotemporal dynamics of ITPlxnD1 and PTFezf2 under ketamine anesthesia across mice.
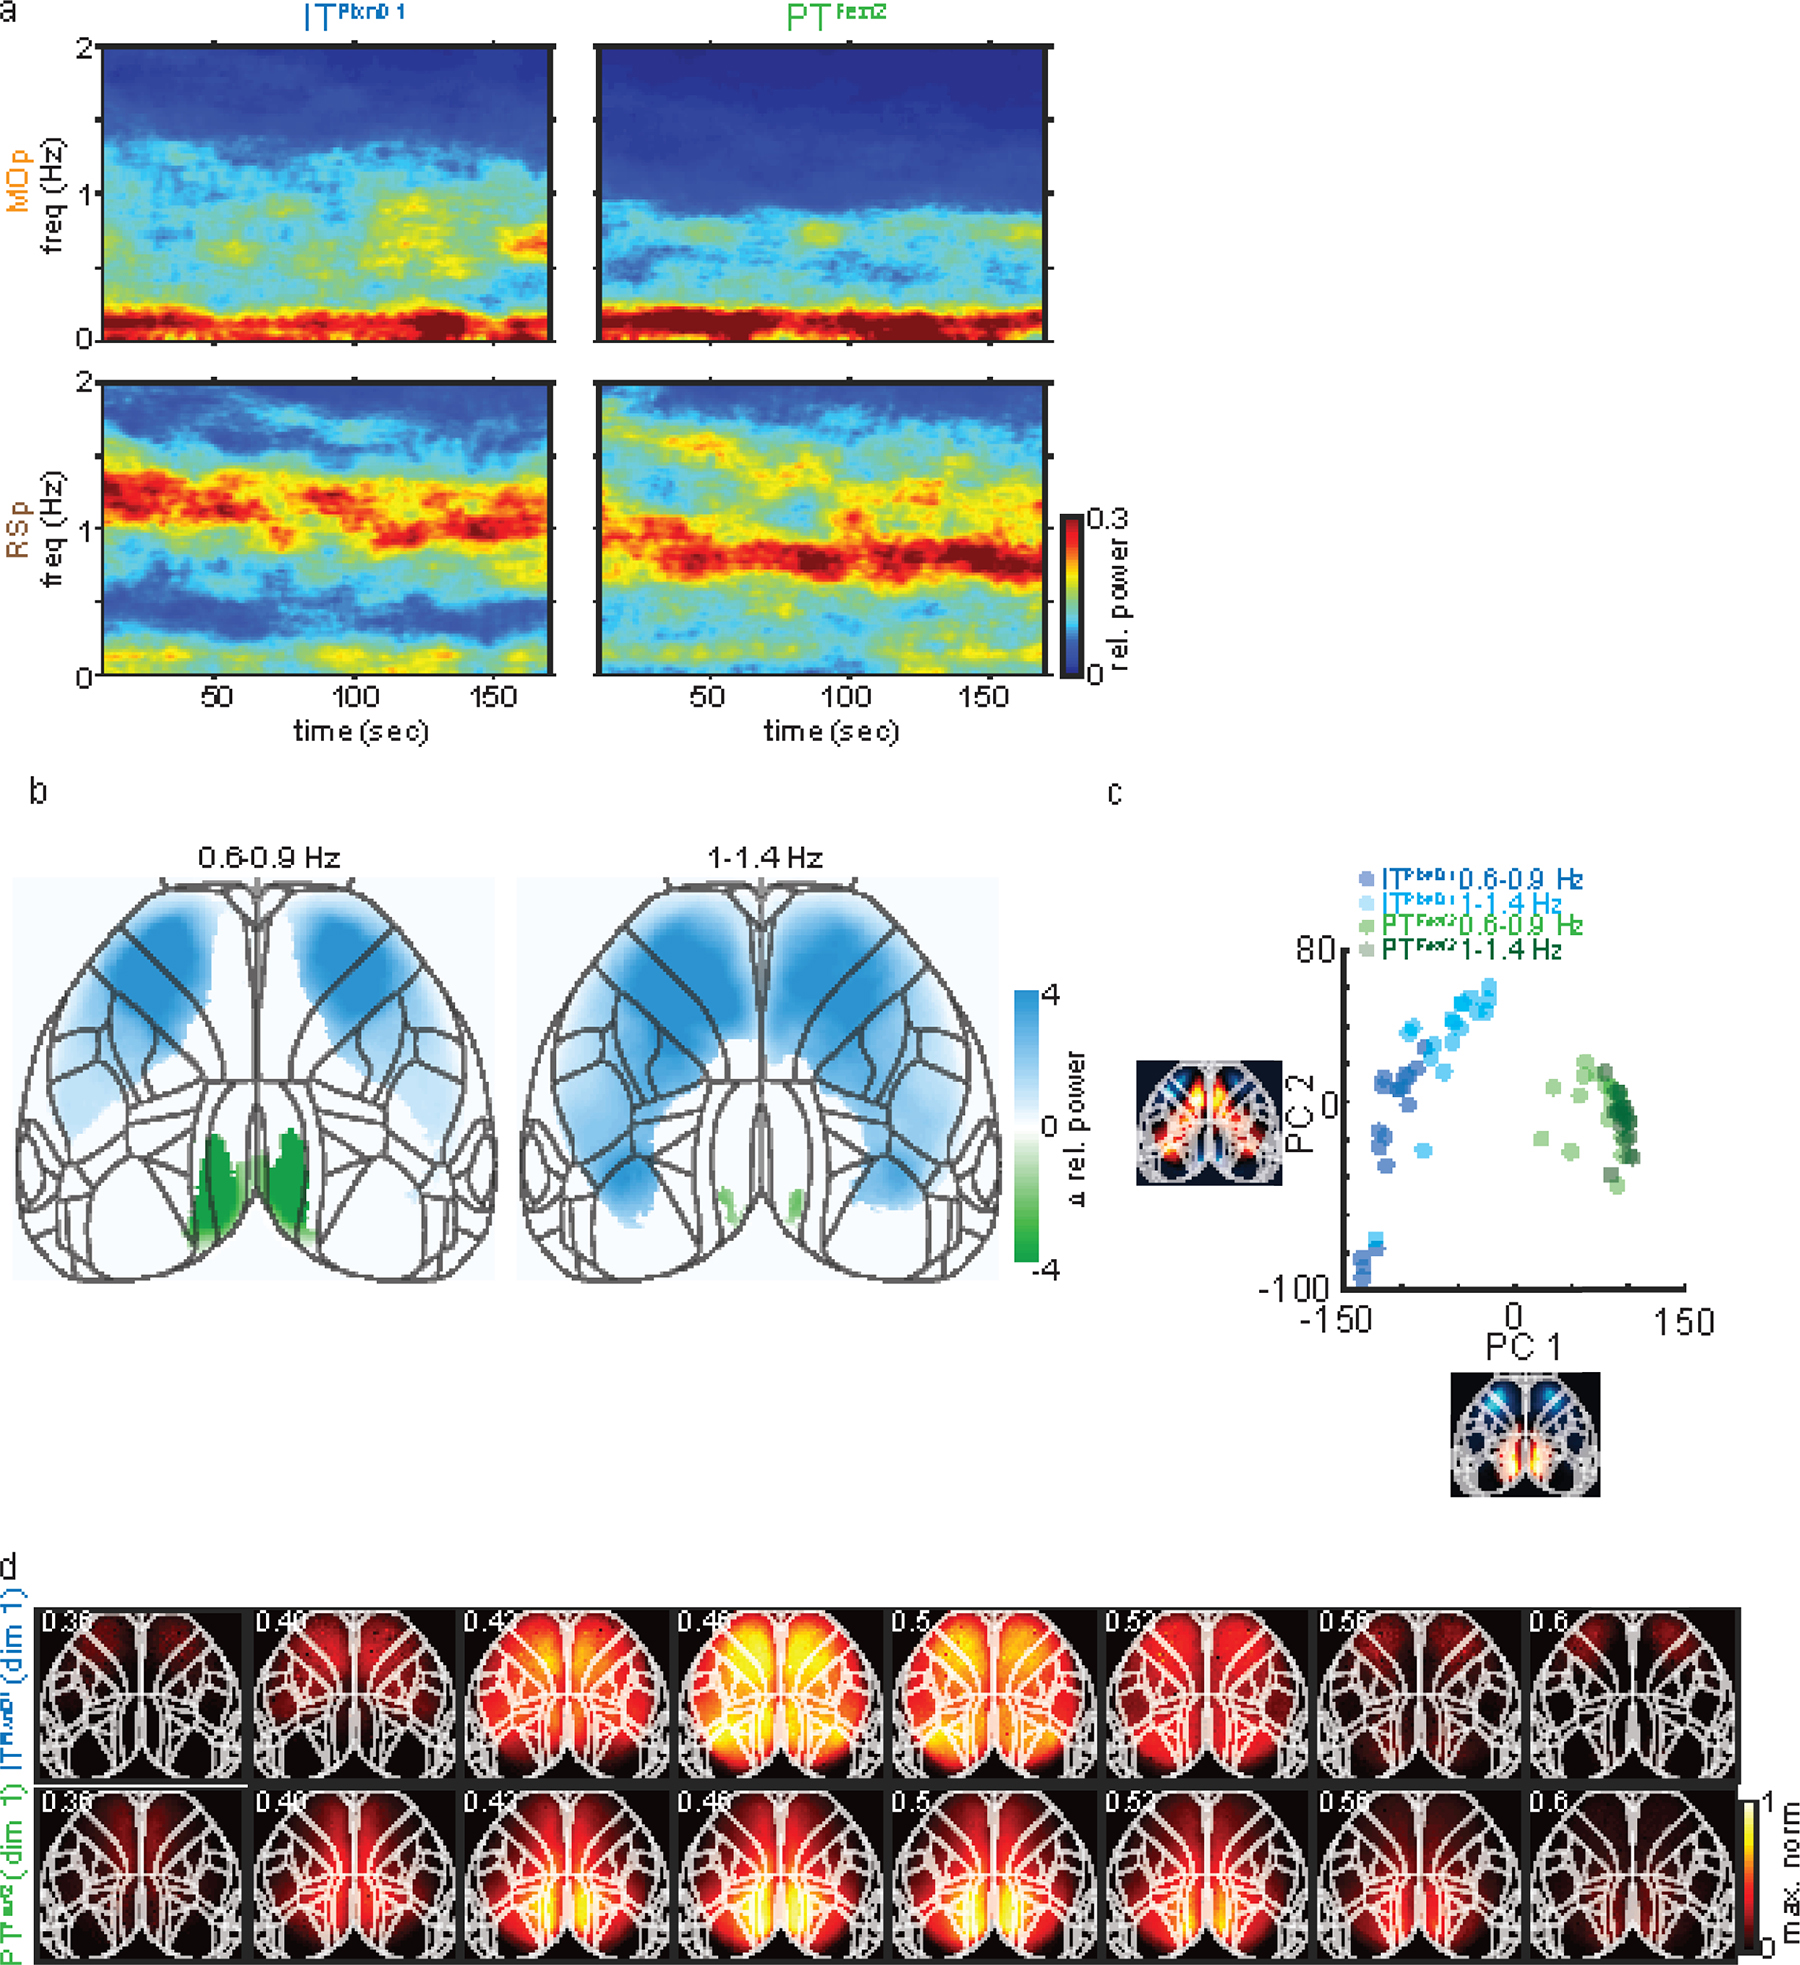
a. Mean spectrogram of ITPlxnD1 and PTFezf2 activity from MOp and RSp (18 sessions across 6 mice for each cell type).
b. Difference between ITPlxnD1 and PTFezf2 average relative power maps for each frequency bands (18 sessions from 6 mice for each cell type). Only significantly different pixels are displayed (two-sided Wilcoxon rank sum test with p-value adjusted by FDR = 0.05). Blue pixels indicate values significantly larger in ITPlxnD1 compared to PTFezf2 and vice versa for green pixels.
c. Distribution of ITPlxnD1 (blue) and PTFezf2 (green) spatial power maps for each frequency band projected to the subspace spanned by the top two principal components (n = 18 maps in each group). ITPlxnD1 and PTFezf2 both clustered independently with further segregation between ITPlxnD1 0.6–0.9 Hz and 1–1.4 Hz frequency bands, substantiating the distinct activation patterns between the two populations.
d. Activation sequence of the most dominant pattern (1st dimension) identified by seqNMF from ITPlxnD1 (top) and PTFezf2 (bottom) activity combined across mice and sessions.