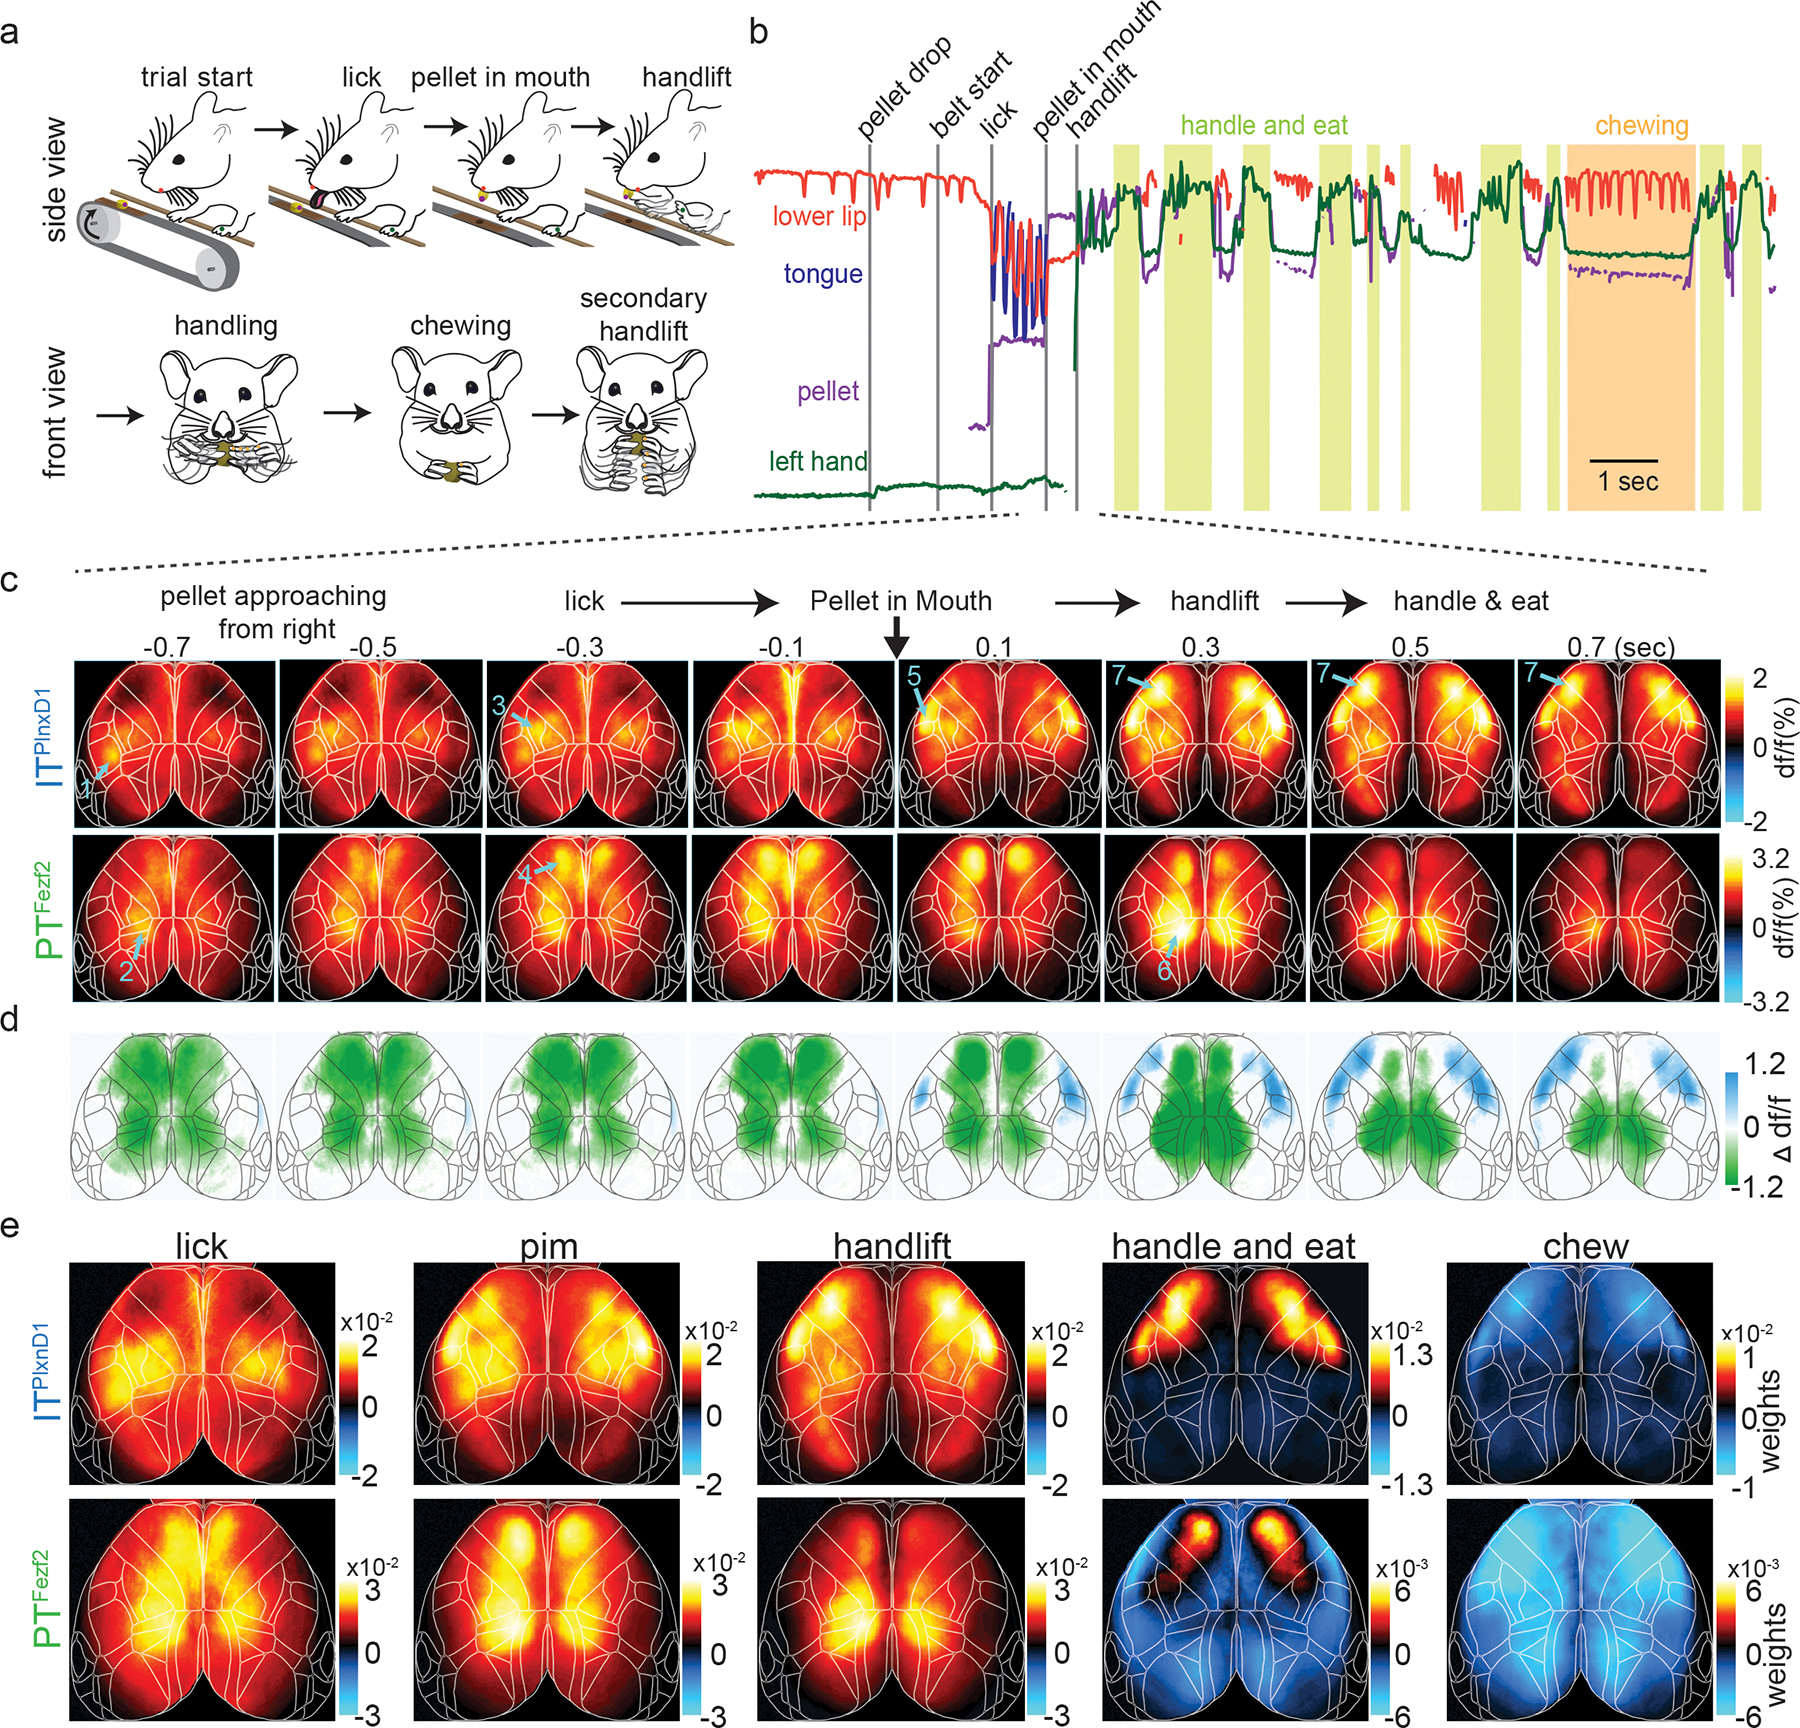
Figure 2. Distinct PTFezf2 and ITPlxnD1 subnetworks tuned to different sensorimotor components of a feeding behavior.

a. Schematic of the head-fixed feeding behavior showing the sequential sensorimotor components.
b. Example traces of tracked body parts and episodes of classified behavior events. Colored lines represent different body parts as indicated (light green shade: handle-and-eat episodes; orange shade: chewing episode).
c. Mean ITPlxnD1 and PTFezf2 sequential activity maps (200 ms steps) during the feeding sequence before and after pellet-in-mouth (PIM) onset (ITPlxnD1 – 23 sessions from 6 mice, PTFezf2 – 24 sessions from 5 mice). Note the largely sequential activation of areas and cell types indicated by arrows and numbers: 1) left barrel cortex (ITPlxnD1) when right whiskers sensed approaching pellet; 2) parietal node (PTFezf2) while making postural adjustments as pellet arrives; 3) forelimb sensory area (ITPlxnD1) with limb movements that adjusted grips of support bar as pellet approaches closer; 4) frontal node (PTFezf2) during lick; 5) orofacial sensory areas (FLP (Frontolateral Posterior), ITPlxnD1) when pellet-in-mouth; 6) parietal node again during hand lift; 7) FLA (Frontolateral Anterior)-FLP (ITPlxnD1) on handling and eating the pellet.
d. Difference between ITPlxnD1 and PTFezf2 average activity maps at each time step as in panel c. Only significantly different pixels are displayed (two-sided Wilcoxon rank sum test with p-value adjusted by False Discovery Rate = 0.05). Blue pixels indicate values significantly larger in ITPlxnD1 compared to PTFezf2 and vice versa for green pixels.
e. Spatial maps of ITPlxnD1 (top) and PTFezf2 (bottom) regression weights from an encoding model associated with lick, PIM, hand lift, eating and handling, and chewing (ITPlxnD1 - 23 sessions from 6 mice, PTFezf2 - 24 sessions from 5 mice).
