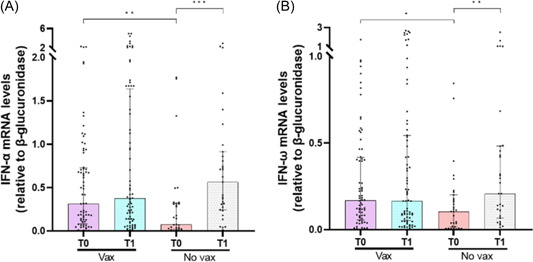
Figure 1.

Comparison of interferon‐α (IFN‐α) (A) and IFN‐ω (B) messenger RNA (mRNA) expression levels before (T0) and 12 days after monoclonal antibodies (mAbs) treatment (T1) between vaccinated (vax) and unvaccinated (No vax) severe acute respiratory syndrome coronavirus 2‐infected patients. Data were analyzed using the Mann–Whitney U test for unpaired samples and the Wilcoxon signed‐rank test for paired samples. *p < .05; **p < .01; ***p < .001.
