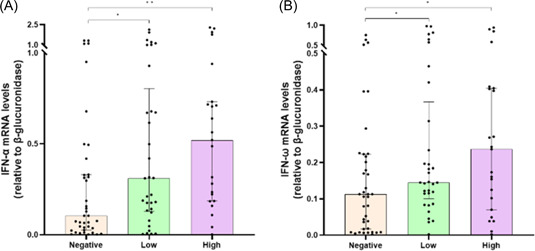
Figure 3.

Comparison of interferon‐α (IFN‐α) (A) and IFN‐ω (B) messenger RNA (mRNA) expression levels before (T0) monoclonal antibodies (mAbs) treatment between severe acute respiratory syndrome coronavirus 2‐infected patients with high (>400 BAU/mL), low (≥33.8 to ≤400 BAU/mL), or negative (<33.8 BAU/mL) anti‐S antibody titers. Data were analyzed using the Mann–Whitney U test. *p < .05; **p < .01.
