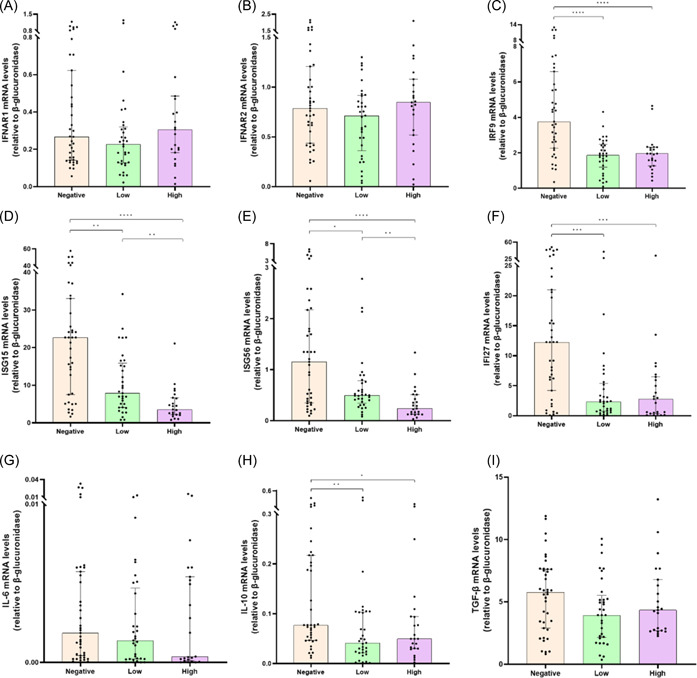
Figure 4.

Comparison of interferon (IFN)‐α and ‐β receptor subunit 1 (IFNAR1) (B), IFNAR2 (B), IFN regulatory factor 9 (IRF9) (C), IFN‐stimulated gene 15 (ISG15) (D), IFN‐stimulated gene 56 (ISG56) (E), IFN‐α‐inducible protein 27 (IFI27) (F), interleukin‐6 (IL‐6) (G), interleukin‐10 (IL‐10) (H), transforming growth factor‐β (TGF‐β) (I) messenger RNA (mRNA) expression levels before (T0) monoclonal antibodies (mAbs) treatment between severe acute respiratory syndrome coronavirus 2 (SARS‐CoV‐2)‐infected patients high (>400 BAU/mL), low (≥33.8 to ≤400 BAU/mL), or negative (<33.8 BAU/mL) anti‐S antibody titers. Data were analyzed using the Mann–Whitney U test. *p < .05; **p < .01; ***p < .001; ****p < .0001.
