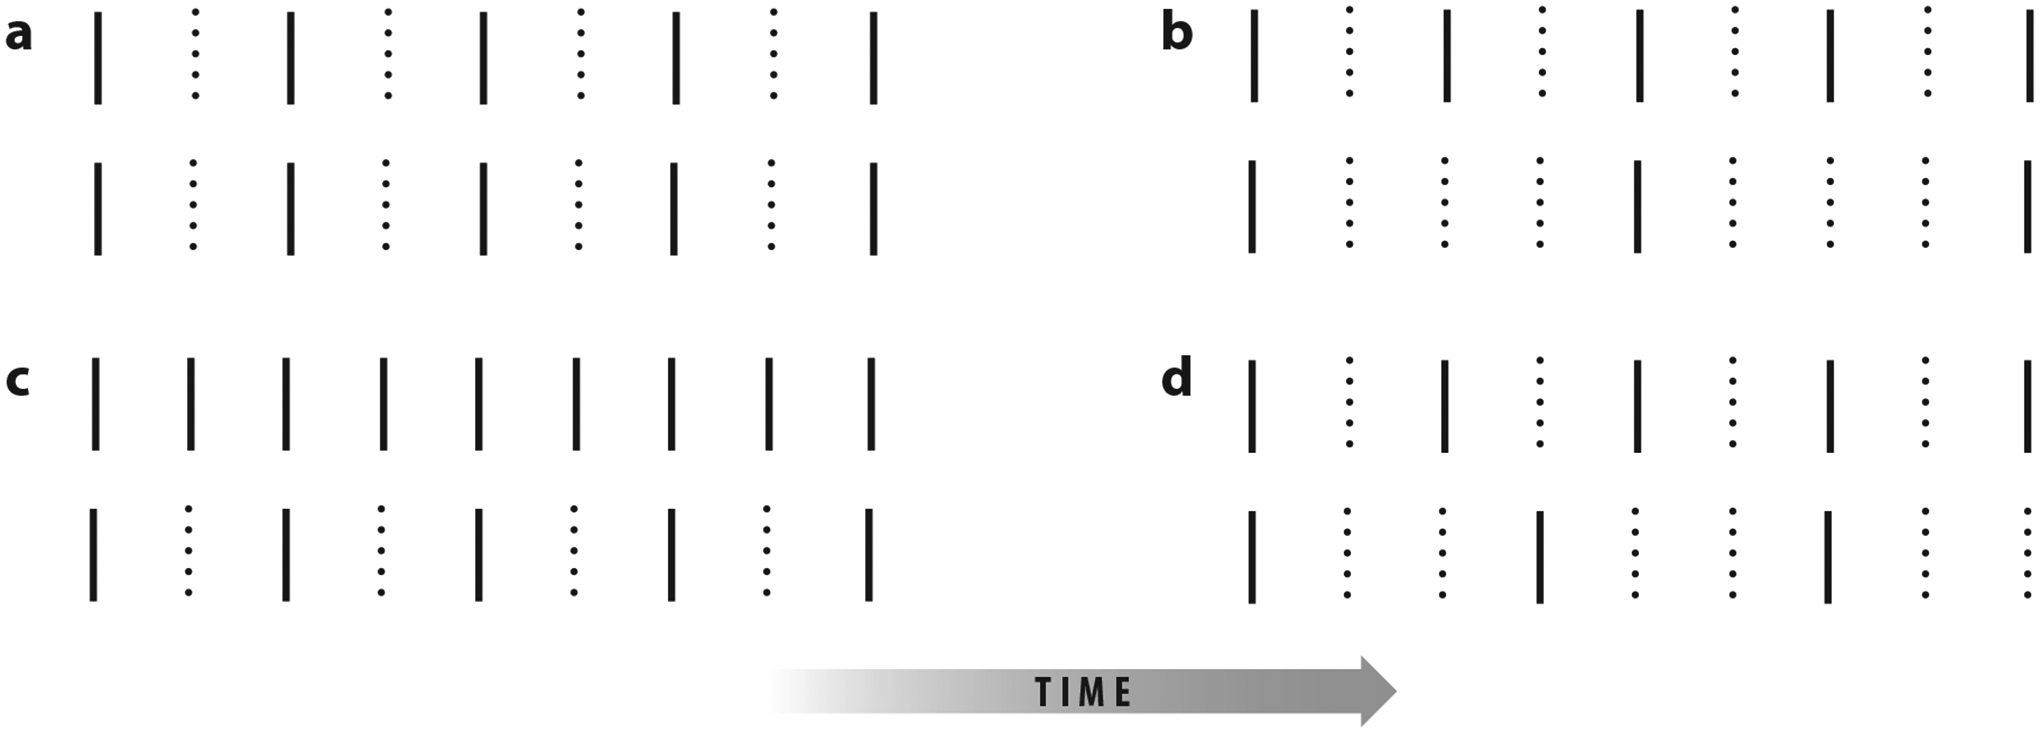
Figure 11.

Four types of structured sampling. Black lines indicate observed data and dotted lines indicate missing data. (a) Both series are subsampled. (b) The standard mixed-frequency case, where only the second series is subsampled. (c) A subsampled version of panel b where each series is subsampled at different rates. (d) A subsampled mixed-frequency series that has no common factor across sampling rates and thus is not a subsampled version of panel b. Figure adapted with permission from Tank et al. (2019).
