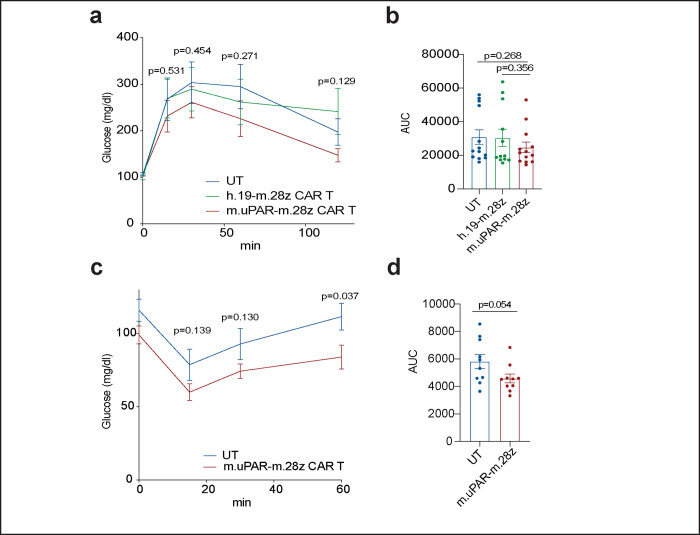
Extended Data Figure 8 |. Effect of uPAR CAR T cells in young and old tissues.
a-b, Mice received cell infusion at 3 months old. a, Levels of glucose before (0 min) and after intraperitoneal administration of glucose (2 g/kg) 2.5 months after cell infusion (n=13 for untransduced T cells; n=12 for h.19-m.28z and n=13 for m.uPAR-m.28z). b, Area under the curve (AUC) representing the results from a. Each point represents a single mouse. c-d, Mice received cell infusion at 18–20 months old. c, Levels of glucose before (0 min) and after intraperitoneal administration of insulin (0.5 units/kg body weight) 2.5 months after cell infusion (n=10 for untransduced T cells and n=10 for m.uPAR-m.28z). d, Area under the curve (AUC) representing the results from c. Each point represents a single mouse. Results of 2 independent experiments (a,b) or 1 independent experiment (c,d). Data are mean ± s.e.m.; p values from two-tailed unpaired Student’s t-test (a-d).

