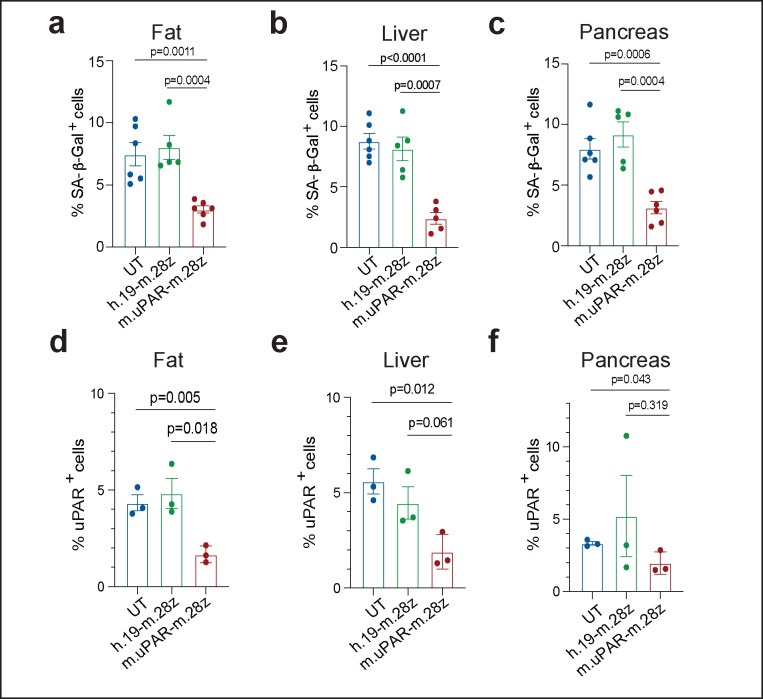
Extended Data Figure 10 |. Long-term effect of uPAR CAR T cells on aged tissues.
Quantification of SA-β-Gal–positive cells 12 months after cell infusion in (a) adipose tissue (n=6 for UT; n=5 for h.19-m.28z; n=6 for m.uPAR-m.28z); (b) liver (n=6 for UT; n=5 for h.19-m.28z; n=5 for m.uPAR-m.28z) and (c) pancreas (n=6 for UT; n=5 for h.19-m.28z; n=6 for m.uPAR-m.28z). d-f, Quantification of uPAR-positive cells in (d) adipose tissue, (e) liver and (f) pancreas 20 days after cell infusion (n=3 per group). Results of 2 independent experiments (a-c) and 1 independent experiment (d-f). Data are mean ± s.e.m.; p values from two-tailed unpaired Student’s t-test (a-f).

