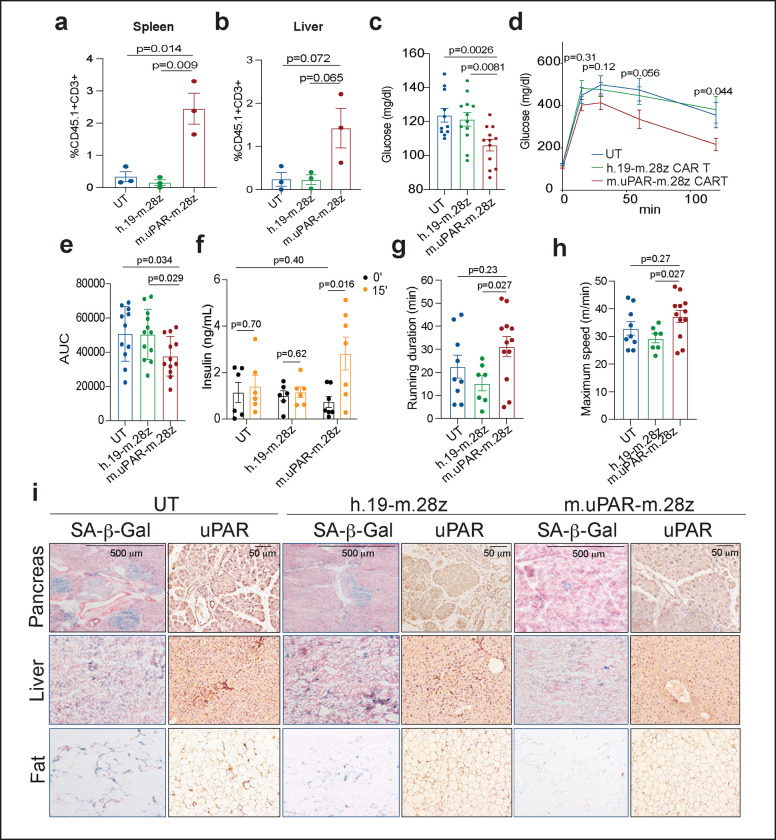
Figure 3 |. uPAR CAR T cells prevent natural age-associated phenotypes.
3–4-month-old C57Bl/6N mice were injected with 0.5×10⁶ m.uPAR-m.28z CAR T cells, h.19-m.28z CAR T cells, or untransduced T cells generated from CD45.1 mice 16h after administration of cyclophosphamide (200 mg/kg). Mice were monitored over time and/or harvested at 15 months of age. a,b, Percentage of CD45.1+ T cells in the spleen (a) or liver (b) of 15-month-old mice 12 months after cell infusion (n=3 mice per group). c, Levels of basal glucose after starvation 15–18 months after cell infusion (n=11 mice for untransduced T cells; n=12 for h.19-m.28z and for m.uPAR-m.28z). d, Levels of glucose before (0 min) and after intraperitoneal administration of glucose (2 g/kg) 15–18 months after cell infusion (sample sizes as in c). e, Area under the curve (AUC) representing the results from d. Each point represents a single mouse. f, Levels of insulin (ng/ml) before and 15 minutes after intraperitoneal glucose (2 g/kg) 15 months after cell infusion (n=6 for untransduced T cells; n=6 for h.19-m.28z; n=7 for m.uPAR-m.28z). g, Time to exhaustion in exercise capacity testing 6 months after cell infusion (n=9 for untransduced T cells; n=7 for h.19-m.28z; n=12 for m.uPAR-m.28z). h, Maximum speed (m/min) in capacity testing 6 months after cell infusion (sample sizes as in g). i, Representative staining of SA-β-Gal and uPAR 15 months after cell infusion. Results are from 1 independent experiment (a-b; f; i) or 2 independent experiments (c-e; g-h). Data are mean ± s.e.m.; p values from two-tailed unpaired Student’s t-test (a-f) or Mann Whitney test (g,h).

