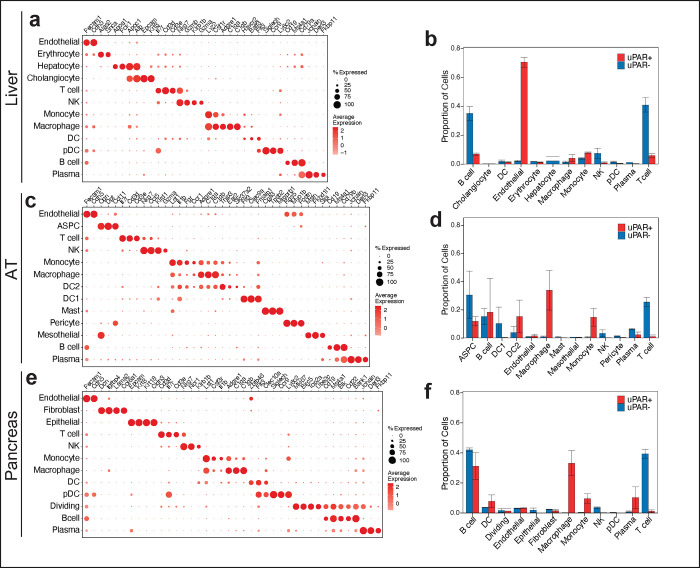
Extended Data Figure 2 |. Single cell profile of aged tissues.
a, Dot plot showing expression of 34 signature genes across the 12 lineages of the liver. The size of the dots represents the proportion of cells expressing a particular marker, and the color scale indicates the mean expression levels of the markers (z-score transformed). b, Fractions of uPAR-positive and uPAR-negative cells in the various lineages in liver (n=4 mice per group). Error bars represent s.d. c, Dot plot showing expression of 40 signature gene expressions across the 13 lineages of the adipose tissue. The size of the dots represents the proportion of cells expressing a particular marker, and the color scale indicates the mean expression levels of the markers (z-score transformed). d, Fractions of uPAR-positive and uPAR-negative cells in the various lineages in adipose tissue (n=4 mice per group). Error bars represent s.d. e, Dot plot showing expression of 40 genes across the 12 lineages of the pancreas. The size of the dots represents the proportion of cells expressing a particular marker, and the color scale indicates the mean expression levels of the markers (z-score transformed). f, Fractions of uPAR-positive and uPAR-negative cells in the various lineages in pancreas (n=4 mice per group). Error bars represent s.d. Data are mean ± s.d.; p values are derived from two-tailed unpaired Student’s t-tests (b,d,f). Results are from 1 independent experiment (a-f).

