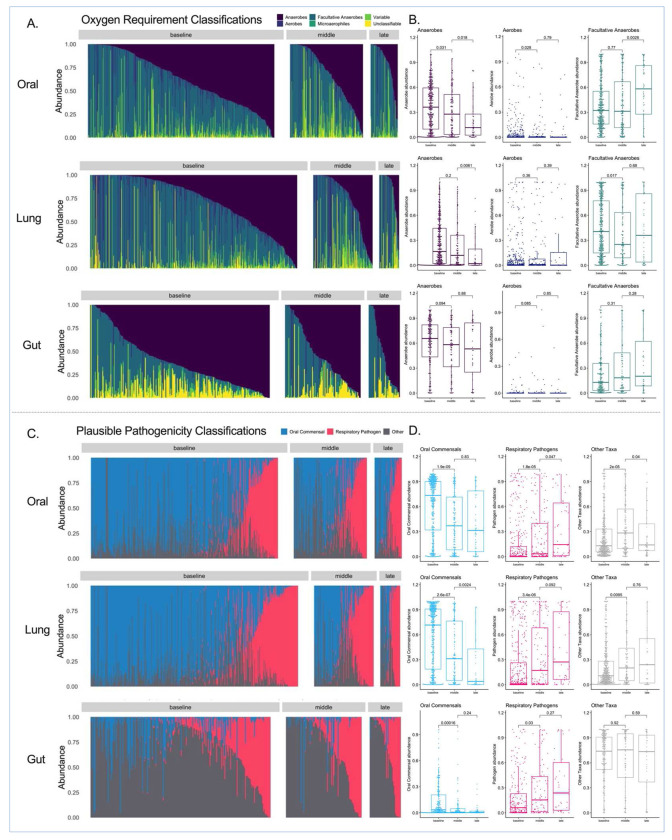
Figure 2: Longitudinal analysis of bacterial composition showed a progressive loss of obligate anaerobes in oral and lung communities as well as enrichment for recognized respiratory pathogens in all three compartments.
Top Panels (A-B): Relative abundance barplots for oral, lung and gut samples with classification of bacterial genera by oxygen requirement into obligate anaerobes (anaerobes), aerobes, facultative anaerobes, microaerophiles, genera of variable oxygen requirement and unclassifiable. Comparisons of relative abundance for the three main categories of bacteria (obligate anaerobes, aerobes and facultative anaerobes) by follow-up interval (baseline, middle and late). Data in boxplots (B) are represented as individual values with median values and interquartile range depicted by the boxplots with comparisons between intervals by non-parametric tests. Bottom Panels (C-D): Relative abundance barplots for oral, lung and gut (F) samples with classification of bacterial genera by plausible pathogenicity into oral commensals, recognized respiratory pathogens and “other” category. Comparisons of relative abundance for these categories of bacteria by follow-up interval (baseline, middle and late) in boxplots (D).

