
Figure 2. Baseline and longitudinal changes in iFW and volume.
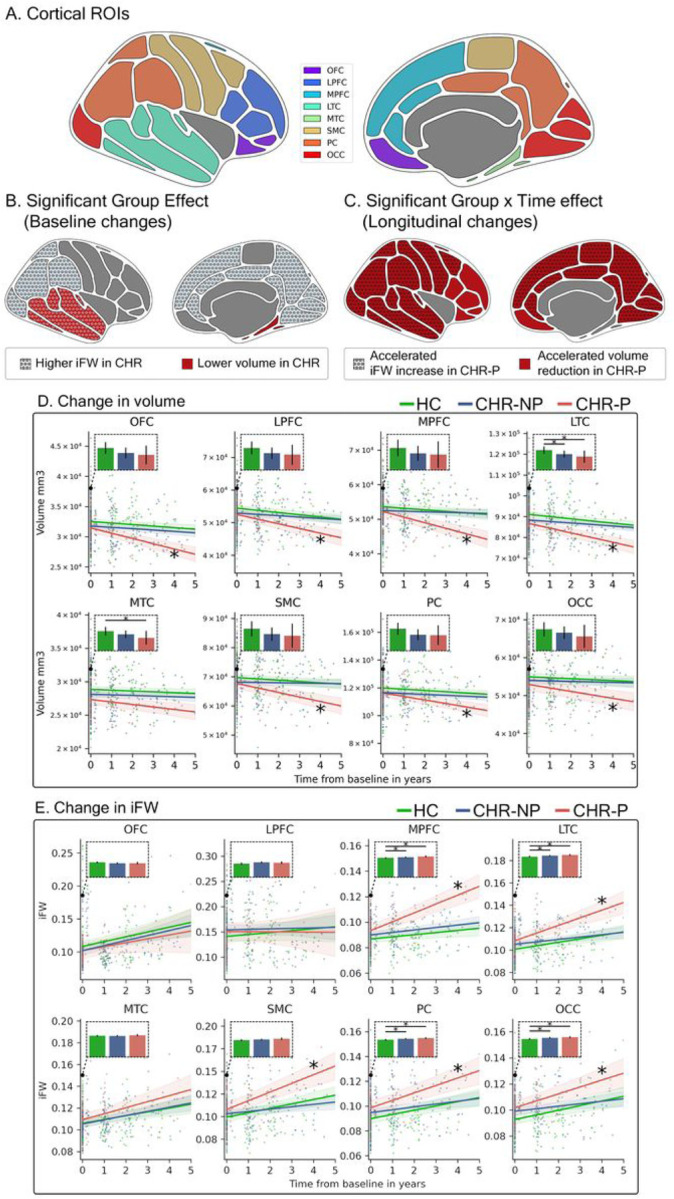
(A) Regions spanning eight cortical lobes were defined: OFC, orbitofrontal cortex, LPFC, lateral prefrontal cortex, MPFC, medial prefrontal cortex, LTC, lateral temporal cortex, MTC, medial temporal cortex, SMC, somatomotor cortex, PC, parietal cortex, OCC, occipital cortex. (B) At baseline, prior to psychosis onset, volume in CHR was significantly lower than in HC (red background) in the LTC and MTC. Significantly higher iFW in CHR compared to HC (dotted circles) were in MPFC, LTC, PC, and OCC, demonstrating a wider extent than the volume changes. (C)Longitudinally, increased rate of volume decline in CHR-P (red background) was found in all regions but the MTC. Increased rate of iFW change over time in CHR-P was found in MPFC, LTC, SMC, PC, and OCC (dotted circles). (D and E) The iFW and volume values, respectively, are plotted for each subject in each cortical region and time point. Lines represent the slopes estimated by each LME model and the shaded area around the lines represent 95 % confidence intervals. * marker on the slope line represents a significantly different rate of change in CHR-P compared to HC. Additional bar plots for each model present the intercepts which model baseline values, where the error bars represent 95% confidence intervals and the horizontal lines with * denote significant differences in the post hoc tests. Orbitofrontal, OFC, lateral prefrontal, LPFC, medial prefrontal, MPFC, lateral temporal, LTC, medial temporal, MTC, somatomotor, SMC, parietal, PC, occipital cortex, OCC, iFW, interstitial free-water, CHR, individuals at clinical high risk, HC, healthy controls.