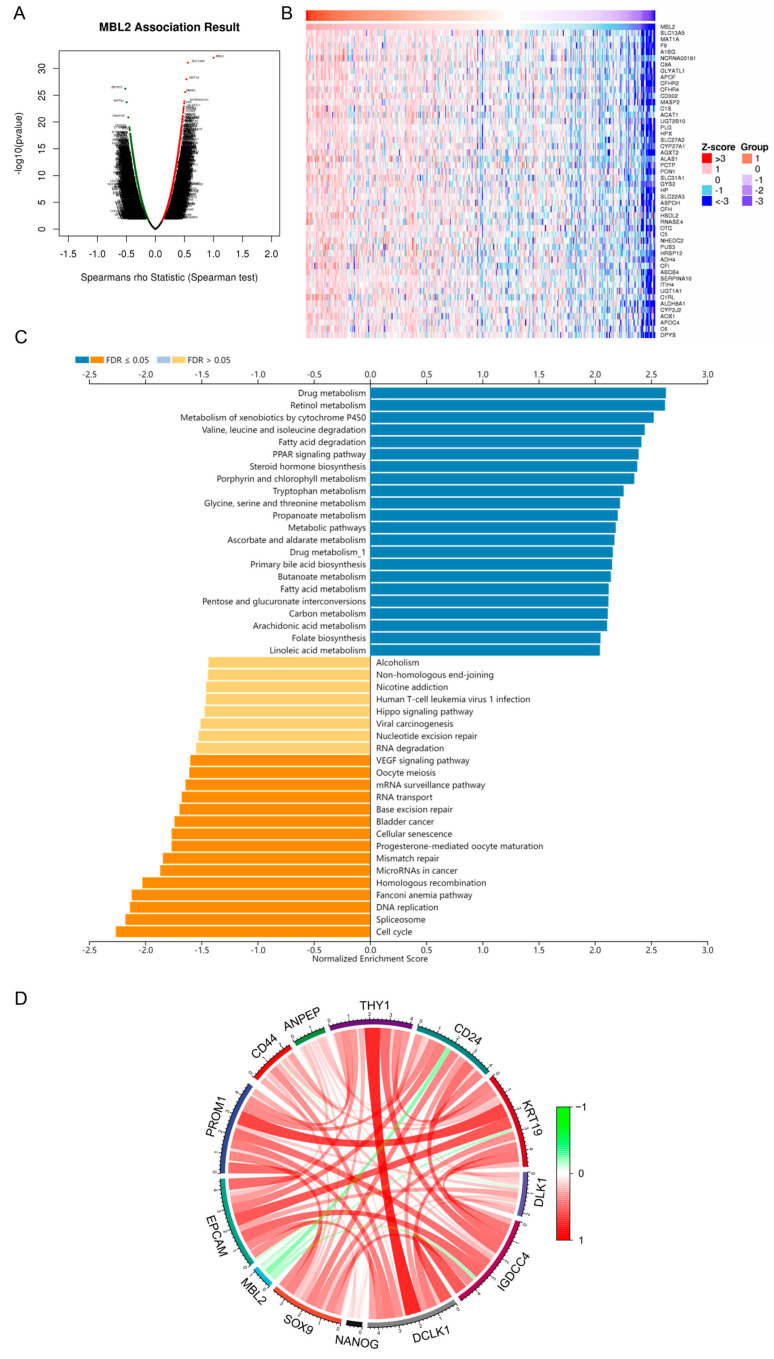
Figure 2.
Analysis of the potential downstream mechanism of MBL2. (A) Genes highly coexpressed with MBL2 were identified through Spearman’s correlation tests in the TCGA-LIHC cohort. (B) Heat maps illustrating the top 50 genes that exhibit positive correlation with MBL2. (C) Significantly enriched gene ontology biological process annotations in HCC. (D) Spearman’s correlation analysis was conducted to examine the relationship between MBL2 expression and the expression of cancer stemness markers in the TCGA-LIHC dataset. The red connections represent positive correlations, and the green connections represent negative correlations. The color depth of a line represents the correlation coefficient. MBL2, mannose-binding lectin 2; TCGA-LIHC, The Cancer Genome Atlas-Liver Hepatocellular Carcinoma; HCC, hepatocellular carcinoma.

