Figure 1.
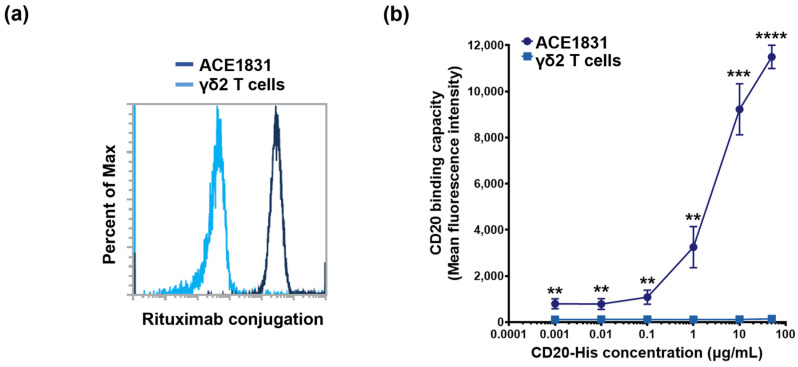
Rituximab conjugation confers γδ2 T cells with CD20 binding capacity. (a) A representative histogram of rituximab conjugation is illustrated. DNA linker-1 and linker-2 were conjugated with γδ2 T cells and rituximab, respectively. Linker-1-conjugated γδ2 T cells and linker-2-conjugated rituximab were mixed and ACE1831, rituximab-linked γδ2 T cells, were generated through DNA hybridization. Un-conjugated γδ2 T cells and ACE1831 were stained with R-phycoerythrin-coupled anti-F(ab’)2 antibody to determine the rituximab conjugation efficiency through flow cytometry. Un-conjugated γδ2 T cells (light blue line) represent negative staining, and efficient rituximab conjugation on ACE1831 (dark blue line) is shown. Percent of Max is the highest point of each peak of the overlaid histogram derived from ACE1831 and γδ2 T cells. (b) CD20 binding capacity of ACE1831 and γδ2 T cells was determined through flow cytometry analysis. The cells were incubated with 0.001, 0.01, 0.1, 1, 10 and 100 μg/mL of human CD20-His recombinant protein, and the CD20-bound cell population was identified through staining with Fluorescein-coupled anti-6X His tag antibody. The study was performed in triplicate in five different experiments, and the representative results are shown. Statistical analysis was performed using the t test. **, p < 0.01; ***, p < 0.001; ****, p < 0.0001.

