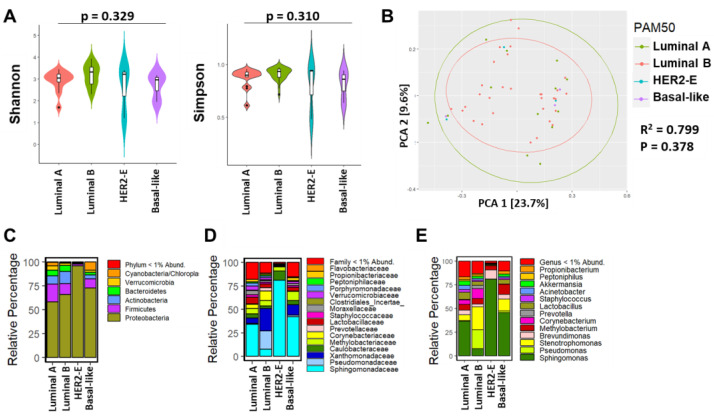
Figure 3.
Breast bacterial community composition varies by PAM50 intrinsic subtypes. (A) Violin plots show median and interquartile range as measured by Shannon and Simpson diversity indices within breast tissue from Ethiopian BC patients. p-value results were obtained from Kruskal–Wallis tests. (B) PC plot shows the clustering pattern of the intrinsic subtypes based on unweighted UniFrac distance and is colored by sample types (green—luminal A, red circles—luminal B, teal—HER2E, and purple circles—basal-like tumor samples); p = 0.378 and R2 = 0.799. Taxonomic composition of the breast microbiome, depicted as relative percentage at the (C) phylum, (D) family, and (E) genus level.

