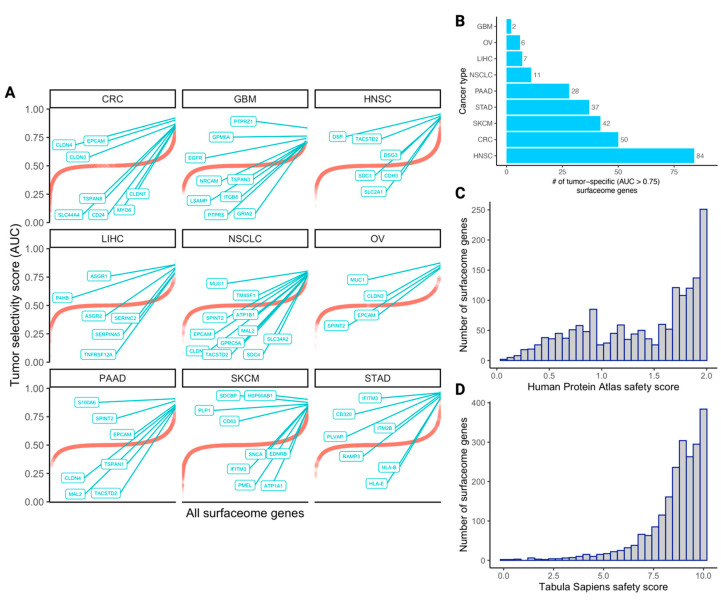
Figure 1.
The landscape of tumor selectivity and safety scores of human surfaceome genes. (A) 1D scatterplots depicting the tumor selectivity scores (AUCs) of all surfaceome genes within each cancer type (red curves). Within each cancer type plot, the top N (where N is < 10) genes are labeled and represented by green points instead of red. Genes are sorted in ascending order on the x-axis from left to right. (B) The number of tumor-specific surfaceome genes (AUC > 0.75) in each cancer type, in ascending order from top to bottom. Histograms depicting the distributions of Human Protein Atlas (HPA)-derived safety scores and Tabula Sapiens (TS)-derived safety scores are shown in (C,D), respectively. Acronyms for the cancer types in panel A are colorectal cancer (CRC), glioblastoma (GBM), head and neck squamous cell carcinoma (HNSC), liver hepatocellular carcinoma (LIHC), non-small cell lung cancer (NSCLC), ovarian cancer (OV), pancreatic adenocarcinoma (PAAD), skin cutaneous melanoma (SKCM), and stomach adenocarcinoma (STAD).

